Categories
Gold

Gold Is at a Critical Juncture Now

Source: Clive Maund for Streetwise Reports   03/08/2021

Technical analyst Clive Maund takes a look at the factors behind gold’s price decline and what’s in store for the metal.

We start this update with the latest version of Larry’s amazing gold chart. As Larry states…

“Gold touched $1683.00 on Friday.

Real close to touching the phantom outside possibility line.

To me this means the final moment of truth should be revealed in the next week.

Huge watershed movement – one way or the other – is about to happen.”


Click on chart to pop up a larger, clearer version.

From the action in gold and across markets on Friday, I believe that gold will reverse to the upside this coming week. What happened on Friday is that, with the markets starting to look really fragile, the Bank of America came riding to the rescue saying that the Fed was “going to exercise yield curve control” or words to that effect, meaning that it will attempt to cap shorter-term yields like the 10-year. Every time since 2008 that the markets have looked like they were going to completely cave in, either the Fed has thrown open the monetary spigots or markets have been bolstered by such rhetoric. Anyway it certainly did the trick and we had a big reversal, with bullish reversal candlesticks appearing all over the place, including in many of our stocks.

A point worth making with respect to Larry’s gold chart is that even if gold were to breach the outermost boundary of the giant Bowl pattern, what Larry refers to as the “phantom outside possibility line,” it may simply mean that a “Handle” is about to form that would complement the Bowl, making it a giant Cup & Handle pattern. As investors in the sector we would rather not see that as if the Handle that formed was proportional to the Cup, it could drag on for anything from 6 to 18 months. However if f gold takes off higher immediately, as looks likely, the move could be really big.

On the 3-year chart we can see gold has reacted all the way back across an expanding channel and now looks like a trading buy for a rally, especially as it is oversold and at an important support level. Bearing in mind what we observed above with respect to it possibly making the Handle of a Cup & Handle pattern, one possibility is that it rallies back up to near the highs of last August and then runs off sideways in a Rectangular pattern bounded by roughly between where it is now and the highs.

On the 1-year chart we see that not only is gold at the bottom of the expanding channel that we observed on the 3-year chart, it is also at the bottom of the downtrend channel in force from last August, which is double reason for it to turn higher here, quadruple if you factor in that it is significantly oversold and at strong support.

Whilst we know that charts admit of any and all possibilities, and that gold’s chart doesn’t look too bad, the GDX chart is more concerning as it shows that this ETF may have already broken down from a large Head-and-Shoulders top, which if valid will project it down towards the lows of March last year. For this to happen the broad stock market would probably have to go into “risk off” mode and tank, and that doesn’t look likely in the foreseeable future given what happened in the markets on Friday. So there is considered to be a fair chance that this potential H&S top pattern will abort.

The market doesn’t care about the economy, that much is already obvious— all it cares about is abundant cheap money, and it threw a tantrum last week because the US Treasury 10-year Yield started to rise to levels that are now becoming concerning, as we can see on the 1-year chart for the 10-year Yield below…

If the 10-year Yield continues any higher it is likely to trigger a much more severe risk-off selloff, so how do stock indices look?

The Dow Jones Industrials doesn’t give a clear indication, nor would you expect it to given that it is a narrow index, and you can only just about make out what’s going on on the S&P500 index, but the index that really gives the game away is the broad Wilshire 5000 Index. On the 6-month chart for this index we can see that upside momentum (MACD) has been fizzling for months, and also that a potential Head-and-Shoulders top is forming, with a line of important support of about 39,200. Thus, if this index drops below 39,000 it could really tank. The Fed therefore needs to pull out all the stops to prevent this happening, which if past performance is prologue, it will do.

Fortunately, it looks like we have a bit of time—there was reversal candle on Friday in this index, in other indices and in many stocks which implies that another rally is starting, but the danger is that this rally might only be a rally to mark out a symmetrical Right Shoulder to complete the potential Head-and-Shoulders top. So we need to see if the Wilshire can drive through the resistance approaching the highs, especially the resistance at the Left Shoulder of the potential H&S top, which is at about 41,000. If it does and the Fed “delivers the goods,” meaning more liquidity, then markets could be “off to the races” again, which this time should be better for the precious metals sector than thus far.

Originally posted on CliveMaund.com on Sunday, March 7, 2021.

Clive Maund has been president of www.clivemaund.com, a successful resource sector website, since its inception in 2003. He has 30 years’ experience in technical analysis and has worked for banks, commodity brokers and stockbrokers in the City of London. He holds a Diploma in Technical Analysis from the UK Society of Technical Analysts.

Sign up for our FREE newsletter at: www.streetwisereports.com/get-news

Disclosure:
1) Statements and opinions expressed are the opinions of Clive Maund and not of Streetwise Reports or its officers. Clive Maund is wholly responsible for the validity of the statements. Streetwise Reports was not involved in any aspect of the article preparation. Clive Maund was not paid by Streetwise Reports LLC for this article. Streetwise Reports was not paid by the author to publish or syndicate this article.
2) This article does not constitute investment advice. Each reader is encouraged to consult with his or her individual financial professional and any action a reader takes as a result of information presented here is his or her own responsibility. By opening this page, each reader accepts and agrees to Streetwise Reports’ terms of use and full legal disclaimer. This article is not a solicitation for investment. Streetwise Reports does not render general or specific investment advice and the information on Streetwise Reports should not be considered a recommendation to buy or sell any security. Streetwise Reports does not endorse or recommend the business, products, services or securities of any company mentioned on Streetwise Reports.
3) From time to time, Streetwise Reports LLC and its directors, officers, employees or members of their families, as well as persons interviewed for articles and interviews on the site, may have a long or short position in securities mentioned. Directors, officers, employees or members of their immediate families are prohibited from making purchases and/or sales of those securities in the open market or otherwise from the time of the decision to publish an article until three business days after the publication of the article. The foregoing prohibition does not apply to articles that in substance only restate previously published company releases.

Charts provided by the author.

CliveMaund.com Disclosure:
The above represents the opinion and analysis of Mr. Maund, based on data available to him, at the time of writing. Mr. Maund’s opinions are his own, and are not a recommendation or an offer to buy or sell securities. Mr. Maund is an independent analyst who receives no compensation of any kind from any groups, individuals or corporations mentioned in his reports. As trading and investing in any financial markets may involve serious risk of loss, Mr. Maund recommends that you consult with a qualified investment advisor, one licensed by appropriate regulatory agencies in your legal jurisdiction and do your own due diligence and research when making any kind of a transaction with financial ramifications. Although a qualified and experienced stock market analyst, Clive Maund is not a Registered Securities Advisor. Therefore Mr. Maund’s opinions on the market and stocks can only be construed as a solicitation to buy and sell securities when they are subject to the prior approval and endorsement of a Registered Securities Advisor operating in accordance with the appropriate regulations in your area of jurisdiction.

Categories
Gold

Silver Market Update: A Nice Buy Spot for the Sector

Source: Clive Maund for Streetwise Reports   03/08/2021

Technical analyst Clive Maund charts silver and looks at what he believes lies ahead.

Silver investors have been getting increasingly frustrated in recent months as silver has basically done little, while Bitcoin, blockchain and selected biotech and tech stocks have soared. We ourselves haven’t paid silver much attention because it has been so dull, and we learned some months back that we could make much bigger gains elsewhere for a while, especially in new tech stocks. However, this does not mean that we have forgotten about it—rather we have been waiting for it to start entering a more dynamic phase, and as we will see in this update, that could happen quite soon, and even if it doesn’t silver and silver investments looks like they are at “buy spots” here.

Let’s start by gaining a big picture perspective using the 12-year chart. On this we see that silver made a clear and decisive breakout from a giant Double Bottom base pattern last July. Observe the highly anomalous and false breakdown from this Double Bottom in March of last year at the time of the general market panic, that was swiftly and dramatically reversed when the Fed came riding to the rescue. Whilst the breakout led to rapid and substantial gains, silver slammed into heavy overhanging supply towards $30 that has kept a lid on the price ever since, and we can clearly see on this chart the origins of this resistance, which was the extensive trading above $30 back in 2011 and 2012. So what now? With the volume pattern positive and volume indicators bullish—both those shown broke above their 2011 highs this year—silver could now forge ahead, provided that a risk off environment is not triggered by rising rates. Here we should note that the bullish pattern in silver would not be damaged even if it dropped back to support at the lower boundary of its recent pattern at $22.

On the 1-year chart we can see the recovery out of the panic lows of March last year, the July breakout from the giant base pattern shown on the 10-year chart, the run to $30 that followed and after that the long consolidation pattern. A few days back on the site we had thought that a trendline drawn from the March lows might hold, and that if it failed, which it has in recent days, a drop back to the support at $22 would follow. However, this trendline was not very significant, which is why it isn’t drawn on this chart, and the action on Friday, not just in silver but in gold and the broad stock market too, coupled with the very bullish alignment of the moving averages, suggests that we just saw an intermediate low in silver on Friday, with many silver stocks giving a buy signal.

On the 3-month chart we can see recent action in much more detail. On this chart we can see how the minor downtrend of recent weeks has completely unwound its earner overbought condition and brought silver back to a zone of support in between its bullishly aligned moving averages, which means that it is at a good point to turn up again.

Various silver stocks made bullish looking candles on Friday, which of course increases the chances of the sector turning higher again here—here’s one example, Hecla Mining…


Originally posted on CliveMaund.com on Sunday, March 7, 2021.

Clive Maund has been president of www.clivemaund.com, a successful resource sector website, since its inception in 2003. He has 30 years’ experience in technical analysis and has worked for banks, commodity brokers and stockbrokers in the City of London. He holds a Diploma in Technical Analysis from the UK Society of Technical Analysts.

Sign up for our FREE newsletter at: www.streetwisereports.com/get-news

Disclosure:
1) Statements and opinions expressed are the opinions of Clive Maund and not of Streetwise Reports or its officers. Clive Maund is wholly responsible for the validity of the statements. Streetwise Reports was not involved in any aspect of the article preparation. Clive Maund was not paid by Streetwise Reports LLC for this article. Streetwise Reports was not paid by the author to publish or syndicate this article.
2) This article does not constitute investment advice. Each reader is encouraged to consult with his or her individual financial professional and any action a reader takes as a result of information presented here is his or her own responsibility. By opening this page, each reader accepts and agrees to Streetwise Reports’ terms of use and full legal disclaimer. This article is not a solicitation for investment. Streetwise Reports does not render general or specific investment advice and the information on Streetwise Reports should not be considered a recommendation to buy or sell any security. Streetwise Reports does not endorse or recommend the business, products, services or securities of any company mentioned on Streetwise Reports.
3) From time to time, Streetwise Reports LLC and its directors, officers, employees or members of their families, as well as persons interviewed for articles and interviews on the site, may have a long or short position in securities mentioned. Directors, officers, employees or members of their immediate families are prohibited from making purchases and/or sales of those securities in the open market or otherwise from the time of the decision to publish an article until three business days after the publication of the article. The foregoing prohibition does not apply to articles that in substance only restate previously published company releases.

Charts provided by the author.

CliveMaund.com Disclosure:
The above represents the opinion and analysis of Mr Maund, based on data available to him, at the time of writing. Mr. Maund’s opinions are his own, and are not a recommendation or an offer to buy or sell securities. Mr. Maund is an independent analyst who receives no compensation of any kind from any groups, individuals or corporations mentioned in his reports. As trading and investing in any financial markets may involve serious risk of loss, Mr. Maund recommends that you consult with a qualified investment advisor, one licensed by appropriate regulatory agencies in your legal jurisdiction and do your own due diligence and research when making any kind of a transaction with financial ramifications. Although a qualified and experienced stock market analyst, Clive Maund is not a Registered Securities Advisor. Therefore Mr. Maund’s opinions on the market and stocks can only be construed as a solicitation to buy and sell securities when they are subject to the prior approval and endorsement of a Registered Securities Advisor operating in accordance with the appropriate regulations in your area of jurisdiction.

Categories
Gold

Careless Wishes and Making a Date with Dr. Copper

Source: Michael Ballanger for Streetwise Reports   03/08/2021

Sector expert Michael Ballanger explores the role of hubris in the banking system, as well as the rising prospects of industrial metals like copper.

“Today we’re still a long way from our goals of maximum employment and inflation averaging 2% over time. . .” —Jerome Powell; March 4, 2021

The week that just passed presented us with more than a few seminal moments, those points in time where a well-constructed course of action comes under scrutiny and doubt creeps out from under the carpet of complacency, hubris and hope. However, doubt has a difficult time surviving in the sunlight of analytical exposure because as one is forced to re-examine the component inputs of any plan, it is the solidity of those inputs that frighten doubt back into the shadows.

The plan to which I dutifully serve has one crucial input, which is actually an assumption. That assumption is that central bankers around the world enjoy a level of adoration and respect that is totally and completely unwarranted. I offer as proof the opening quote from last Thursday’s speech by U.S. Fed Chairman Jerome Powell, where he brazenly proclaims that the U.S. is “a long way” from “inflation averaging 2% over time,” while ignoring either by accident or intent, that costs of food, housing, medicine and electricity (especially in Texas) are escalating in Weimar-like leaps and bounds.

Over the decades that I have been writing about the financial markets, I have urged my followers to use four books as primers for understanding markets, human society and history. Those books are (in order of importance):

  • Reminiscences of a Stock Operator (Edwin LeFevre; 1923)
  • The Battle for Investment Survival (Gerald Loeb; 1935)
  • Atlas Shrugged (Ayn Rand; 1957)
  • When Money Dies: The Nightmare of Deficit Spending, Devaluation, and Hyperinflation in Weimar Germany (Adam Fergusson; 2012)

As diverse as they might appear to be, these four writings carry more relevancy in 2021 than they ever did when they were first published. There exists in all four books characters that embody “men of power” with an ability, neither earned nor bestowed, to make decisions that affect millions of human lives, and in all cases, when historians look back in retrospect, those “men of power” were either very lucky or disastrously unlucky with their choices, because not one of them had any clue as to the certainty of outcome of their decisions. Memoirs by Churchill after WWII confirm that many of his decisions were no better than “gambles made from desperation.”

So, with that in mind, I ask you: “What power was bestowed upon Jerome Powell that allows him to implement a policy maneuver that encourages inflation and destruction of the purchasing power of a citizen’s savings?”

To say that Powell carries an ample amount of hubris into his deliberations is an understatement of the highest order. Of even greater importance is the disingenuity of his stated goals, because once one understands the role of the Federal Reserve in terms of who it serves, the only inflation they give a hoot about is that which affects bank collateral. If the American banking system had a need to purchase collateral in the open market, the Fed’s stated goals would be opposite to where they are today; deflation would be the Fed’s goal, allowing its member bank masters to access lower (“deflating”) prices.

However, all debt on the balance sheets of the member banks is backed by all forms of collateral, such as office buildings, residences, warehouses and (of course) stocks, because all of those corporate bond issues floated in the past two decades, enabling mammoth “buy-backs” of corporate equity, have stocks as collateral.

The purpose of the Fed is to protect the member banks—period. The cost of living of the average citizen is immaterial to any discussion carried out in any boardroom by any and all central bankers in all countries. Further, this move to promote inflation is a very dangerous wish in an environment of pandemic-induced hardship, and it is important the Fed governors, led by the former stock peddler Powell, remember that old and very timely adage: “Be careful what you wish for.”

It was fifty-one weeks ago this weekend that I penned the words “Generational Buying Opportunity” to the charts of the GDX and GDXJ, and urged all subscribers to “back up the truck” for the opening of trading for Monday, March 16, 2020. It turned out to be exactly that, as the big gold miner exchange-traded funds (ETFs) reversed their COVID crashes and rallied 180% in the following five months.

This week I was bombarded with emails, DMs and texts (nobody talks on the phone anymore for fear of catching the virus), asking me if I was “backing up the truck again,” and my answer was a categoric “NO,” because conditions here in 2021 are more euphoria-like than panic-like. While gold miners are certainly cheaper than they were last summer and worthy of a well-deserved bounce, I am not as compelled as I was last year—at least not yet.

Silver is a completely different animal right now. The chart shown below is diametrically opposite to where it was before the #SilverSqueeze nonsense materialized.

You will all recall the piece I wrote one month ago, entitled “The Importance of Stealth Investing,” as a warning to every new, fuzzy-cheeked Millennial investor that to listen to those silver “gurus” who promised you they would “Crush the Banks” by creating a GameStop-like squeeze due to their sheer numbers. . .Well, how did that work out for you? Not only was the silver chart in great shape a month ago, but it was also forging ahead toward US$30, quietly riding a modest uptrend, minding its own business, totally off any of the bullion bank radar screens. Then “WHAM!”—the “#Silversqueeze Movement” stuck a large spear into the underbelly of the dozing bullion bank beast, only to watch it spring into action and absolutely crush the army of odd-lotters trying to take on the fire-breathing dragons with squirt guns.

It was painful to watch, and had it not been such a flagrant, in-your-face, beating taken by the silver bugs, I might have found it somewhat amusing. What I did find it was predictable and just as “a lesson learned is a lesson earned”; when it comes to the silver market, stealth is good. Silver needs to return to its unassuming ways and rebuild the technical position, which it should over time. I see a possibility of a US$22 re-test of the late-September lows, but by no means a certainty.

The chart shown above is a beautiful comparison of the Goldman Sacks Commodity Index to the Dow Jones Industrial Index, which is not unlike the Gold:Dow ratio, which also is a very popular graphic.

I have recently added copper to the list of “must-own” assets in the last month, and I continue to seek out companies that are producing, developing, and/or exploring for red metal. I added one this week (reserved for subscribers), and have a feeling that the developers working in favorable jurisdictions are where to focus. GGM Advisory already has exposure through Getchell Gold Corp.’s (GTCH:CSE; GGLDF:OTCQB) Star Point/Star South and Norseman Silver Ltd.’s (NOC:TSX.V) Cariboo projects, so the third name beefs up the allocations as I seek out additional candidates.

As the world turns more and more to electricity, generating stations fueled by non-fossil fuel energy sources, such as nuclear energy, are going to be back in vogue, and since copper and silver are the two best electrical conductors in nature, I see investment capital flowing to the junior copper companies in growing numbers and urgency.

With the Dow Jones within a stone’s throw of record highs, the chart shown below illustrates the relative attractiveness of copper, as the ratio of Copper-to-Dow Jones has not even made it back to the 2008 Great Financial Crisis lows, while it would need to advance over 330% to reach the 2011 highs.

I am working on a fourth copper investment opportunity as this is being written, and will provide details shortly through the Special Situations report currently in progress.

The final point of consideration for all subscribers surrounds the pending infrastructure bill that is soon to be in front of the U.S. Congress. Whatever else is being either replaced or newly constructed, there is one commodity that is going to be required—copper. Whether it is wiring or plumbing or in the electric vehicles delivering them, demand is going to surge. Deposits that are sub-economic today are going to be skated onside by rocketing demand. Since rising inflation is welcomed by way of the “careless wishes” of policymakers the world over, there is no better way to take advantage than a date with Dr. Copper.

Originally published March 6, 2021.

Follow Michael Ballanger on Twitter @MiningJunkie.

Originally trained during the inflationary 1970s, Michael Ballanger is a graduate of Saint Louis University where he earned a Bachelor of Science in finance and a Bachelor of Art in marketing before completing post-graduate work at the Wharton School of Finance. With more than 30 years of experience as a junior mining and exploration specialist, as well as a solid background in corporate finance, Ballanger’s adherence to the concept of “Hard Assets” allows him to focus the practice on selecting opportunities in the global resource sector with emphasis on the precious metals exploration and development sector. Ballanger takes great pleasure in visiting mineral properties around the globe in the never-ending hunt for early-stage opportunities.

Sign up for our FREE newsletter at: www.streetwisereports.com/get-news

Disclosure:
1) Michael J. Ballanger: I, or members of my immediate household or family, own securities of the following companies mentioned in this article: Getchell Gold, Norseman Silver. My company has a financial relationship with the following companies referred to in this article: Getchell Gold. I determined which companies would be included in this article based on my research and understanding of the sector. Additional disclosures are below.
2) The following companies mentioned in this article are billboard sponsors of Streetwise Reports: None. Click here for important disclosures about sponsor fees. As of the date of this article, an affiliate of Streetwise Reports has a consulting relationship with Getchell Gold. Please click here for more information.
3) Statements and opinions expressed are the opinions of the author and not of Streetwise Reports or its officers. The author is wholly responsible for the validity of the statements. The author was not paid by Streetwise Reports for this article. Streetwise Reports was not paid by the author to publish or syndicate this article. Streetwise Reports requires contributing authors to disclose any shareholdings in, or economic relationships with, companies that they write about. Streetwise Reports relies upon the authors to accurately provide this information and Streetwise Reports has no means of verifying its accuracy.
4) This article does not constitute investment advice. Each reader is encouraged to consult with his or her individual financial professional and any action a reader takes as a result of information presented here is his or her own responsibility. By opening this page, each reader accepts and agrees to Streetwise Reports’ terms of use and full legal disclaimer. This article is not a solicitation for investment. Streetwise Reports does not render general or specific investment advice and the information on Streetwise Reports should not be considered a recommendation to buy or sell any security. Streetwise Reports does not endorse or recommend the business, products, services or securities of any company mentioned on Streetwise Reports.
5) From time to time, Streetwise Reports LLC and its directors, officers, employees or members of their families, as well as persons interviewed for articles and interviews on the site, may have a long or short position in securities mentioned. Directors, officers, employees or members of their immediate families are prohibited from making purchases and/or sales of those securities in the open market or otherwise from the time of the decision to publish an article until three business days after the publication of the article. The foregoing prohibition does not apply to articles that in substance only restate previously published company releases. As of the date of this article, officers and/or employees of Streetwise Reports LLC (including members of their household) own securities of Getchell Gold and Norseman Silver, companies mentioned in this article.

Michael Ballanger Disclaimer: This letter makes no guarantee or warranty on the accuracy or completeness of the data provided. Nothing contained herein is intended or shall be deemed to be investment advice, implied or otherwise. This letter represents my views and replicates trades that I am making but nothing more than that. Always consult your registered advisor to assist you with your investments. I accept no liability for any loss arising from the use of the data contained on this letter. Options and junior mining stocks contain a high level of risk that may result in the loss of part or all invested capital and therefore are suitable for experienced and professional investors and traders only. One should be familiar with the risks involved in junior mining and options trading and we recommend consulting a financial adviser if you feel you do not understand the risks involved.

( Companies Mentioned: GTCH:CSE; GGLDF:OTCQB,
NOC:TSX.V,
)

Categories
Gold

McAlinden Research Partners: Copper Leads a Commodities Supercycle

Source: McAlinden Research for Streetwise Reports   03/08/2021

McAlinden Research Partners explains why it believes copper is on the upswing, noting banks are becoming “more bullish on the red metal.”

Summary: Copper futures recently touched a decade high as key investment banks openly declared a “supercycle,” raising their price targets through 2022. Net positions in copper are their longest since December, copper miners’ cash flows are climbing, and stockpiles continue to trend downward with little to no relief in sight—a particularly shocking development, considering the world is on the precipice of an electrification boom.

Related ETF & Stocks: iPath Series B Bloomberg Copper Subindex Total Return ETN (JJC); Global X Copper Miners ETF (COPX); Freeport-McMoRan Inc. (FCX:NYSE); Glencore International Plc (GLEN:LSE); BHP Billiton Ltd. (BHP:NYSE; BHPLF:OTCPK)

On Feb. 24, copper prices hit their highest level in 10 years, smashing through $4.30 per pound (more than $9,000 per tonne). That surge helped copper close out its strongest month since 2016, as prices based on the most active copper futures contracts ended more than 15% higher for the month of February, according to Dow Jones Market Data.

To receive all of MRP’s insights in your inbox Monday–Friday, follow this link for a free 30-day trial. This content was delivered to McAlinden Research Partners clients on March 2.

Though the red metal lost some ground over the last week, amid the rout in equity and bond markets, futures held their ground above the $4 mark and closed at about $4.09 on Monday. The price spike has prompted analysts at Goldman Sachs, Citigroup and others to raise their bets on continually rising copper prices.

Jeff Currie, head of commodity research at Goldman Sachs, recently said that metals such as copper are already at “supercycle levels,” noting that we are headed into a global boom in electrification with drained stockpiles. “We have no copper. . .and we have not even started the energy transition story of electrifying the world. . .Copper is the only thing we know that can conduct electricity at the rate needed,” he said. Last week, Goldman Sachs raised its 12-month copper price target to $10,500 per tonne, along with $9,200 in three months, $9,800 in six.

Citigroup also alluded to an ongoing “supercycle” in the copper market, upping their call on copper prices for 2021 and 2022, forecasting $10,000 per metric ton, with a “bull case” for $12,000 per ton. Citi also upgraded shares of leading copper miner Freeport McMoRan to Buy from Neutral.

Miners like FCX have seen huge benefits flow to their balance sheets from buoyant copper prices. Per JP Morgan, Freeport, which has just reinstated its dividend and set out a new policy for shareholder returns, could generate $14bn of free cash flow from 2021 to 2023.

The Financial Times reported last month that BHP, the world’s largest miner, would pay an interim dividend of $5.1 billion ($5.1B) as profits hit a seven-year high. Glencore said it would resume its payout with a $1.6 billion return after scrapping its annual dividend in August.

Natalie Scott-Gray, a senior metals analyst at StoneX, forecasts copper demand in 2021 will rise by about 5% year-on-year (yoy), outstripping supply, which she expects to grow by 2.3% yoy. If her predictions come true, Mining.com notes that the global copper supply will move from a small surplus in 2020 to a potential deficit of more than 200,000 tonnes of copper this year.

Overall, large base metals speculators have continued to steadily increase their net long positions in the copper futures markets over the last month, according to the latest Commodity Futures Trading Commission (CFTC) data. The non-commercial futures contracts of copper futures, traded by large speculators and hedge funds, totaled a net position of 75,404 net contracts in the data reported through Feb. 22, a weekly gain of 1,495 net contracts and the highest level since last December.

According to the Financial Post, inventories of copper in warehouses registered with the London Metal Exchange (LME) closed out last month at 74,200 tonnes, down by 31,600 tonnes since the start of January.

Some metrics show copper prices still have some catching up to do. As Barron’s notes, the copper to gold ratio, which expresses the value investors assign to copper against that of the safe haven gold, is currently 0.13, meaning the price of unit of copper is just over one-tenth the price of a unit of gold, whereas the ratio’s long-term average is almost 0.3, according to Pavilion Global Markets.

Though some have suggested that continuously rising copper prices may spur a rush for replacements, substitution with aluminum or plastics has experienced a marked downward trend in recent years. As Bloomberg writes, aluminum’s poorer conductivity and larger volume could pose technical challenges that outweigh the commercial benefits in corners of the market that are set to grow the fastest, such as electric vehicles (EVs) and renewable energy. JPMorgan recently said copper demand from those sources would rise from 925,000 tonnes this year to 4.2 million tonnes by 2030.

MRP has noted that green technologies are likely to experience a new wave of federal assistance in the U.S. under the Biden administration.

Biden has a plan to install 500,000 electric vehicle charging cords by 2030, roughly a fivefold increase in the nation’s EV infrastructure that could cost more than $5 billion. Bloomberg writes that the infrastructure milestone would cover 57% of the charging that U.S. vehicles will need by 2030 and could spark the sale of some 25 million electric cars and trucks.

BloombergNEF forecasts by 2040 there will be a need for 12 million charging points, each requiring about 10 kg of copper.

The proliferation of electric vehicles that could result from a massive buildout of charging stations has the potential to push copper demand even higher, considering EVs take around 83 kilograms of copper on average.

Solar panels and wind farms need as much as five times the copper needed for fossil fuel power generation, according to industry estimates. Per the Financial Times, analysts predict a supply crunch unless new mines are discovered and developed quickly.

Ongoing investment in these same technologies throughout the European and Chinese markets will provide an even larger source of demand.

Another bearish argument has focused on a large amount of scrap copper being held off the market for now. Bloomberg reports that copper scrap prices headed for an unprecedented 11th monthly advance, as the premium people are willing to pay to secure refined metal remains elevated and signals the increasing appeal of scrap. However, while buyers are indeed becoming more desperate to secure immediate supplies of copper and turning to the scrap market for relief, scrap hordes are a lot smaller than they used to be.

Back in December, Michael Lion, a trader at Hong Kong-based Everwell Resources, told Fastmarkets: “These days, there are no longer people holding big. . .inventories in the scrap industry—like [they would have done] 20 to 30 years ago when the industry was dominated by family businesses. So, the increase in prices does not do that much in [terms of] drawing out much more material.”

MRP added LONG Copper and Copper Miners to our list of themes on July 17, 2020.
We’ve been tracking the theme with the iPath Series B Bloomberg Copper Subindex Total Return ETN (JJC) and the Global X Copper Miners ETF (COPX), which have returned +39% and +92%, respectively, over the life of the theme. Each of those have outperformed the S&P 500’s return of +21% over the same period.

Charts

coppermac1

coppermac2

coppermac3

 McAlinden Research Partners
McAlinden Research Partners (MRP) provides independent investment strategy research to investors worldwide. The firm’s mission is to identify alpha-generating investment themes early in their unfolding and bring them to its clients’ attention. MRP’s research process reflects founder Joe McAlinden’s 50 years of experience on Wall Street. The methodologies he developed as chief investment officer of Morgan Stanley Investment Management, where he oversaw more than $400 billion in assets, provide the foundation for the strategy research MRP now brings to hedge funds, pension funds, sovereign wealth funds and other asset managers around the globe.

Sign up for our FREE newsletter at: www.streetwisereports.com/get-news

Disclosure:
1) McAlinden Research Partners disclosures are below.
2) The following companies mentioned in this article are billboard sponsors of Streetwise Reports: None. Click here for important disclosures about sponsor fees. The information provided above is for informational purposes only and is not a recommendation to buy or sell any security.
3) Statements and opinions expressed are the opinions of the author and not of Streetwise Reports or its officers. The author is wholly responsible for the validity of the statements. The author was not paid by Streetwise Reports for this article. Streetwise Reports was not paid by the author to publish or syndicate this article. Streetwise Reports requires contributing authors to disclose any shareholdings in, or economic relationships with, companies that they write about. Streetwise Reports relies upon the authors to accurately provide this information and Streetwise Reports has no means of verifying its accuracy.
4) This article does not constitute investment advice. Each reader is encouraged to consult with his or her individual financial professional and any action a reader takes as a result of information presented here is his or her own responsibility. By opening this page, each reader accepts and agrees to Streetwise Reports’ terms of use and full legal disclaimer. This article is not a solicitation for investment. Streetwise Reports does not render general or specific investment advice and the information on Streetwise Reports should not be considered a recommendation to buy or sell any security. Streetwise Reports does not endorse or recommend the business, products, services or securities of any company mentioned on Streetwise Reports.
5) From time to time, Streetwise Reports LLC and its directors, officers, employees or members of their families, as well as persons interviewed for articles and interviews on the site, may have a long or short position in securities mentioned. Directors, officers, employees or members of their immediate families are prohibited from making purchases and/or sales of those securities in the open market or otherwise from the time of the decision to publish an article until three business days after the publication of the article. The foregoing prohibition does not apply to articles that in substance only restate previously published company releases.

McAlinden Research Partners:
This report has been prepared solely for informational purposes and is not an offer to buy/sell/endorse or a solicitation of an offer to buy/sell/endorse Interests or any other security or instrument or to participate in any trading or investment strategy. No representation or warranty (express or implied) is made or can be given with respect to the sequence, accuracy, completeness, or timeliness of the information in this Report. Unless otherwise noted, all information is sourced from public data.
McAlinden Research Partners is a division of Catalpa Capital Advisors, LLC (CCA), a Registered Investment Advisor. References to specific securities, asset classes and financial markets discussed herein are for illustrative purposes only and should not be interpreted as recommendations to purchase or sell such securities. CCA, MRP, employees and direct affiliates of the firm may or may not own any of the securities mentioned in the report at the time of publication.

Categories
Gold

Canadian Miner Advancing One of the World’s Few ‘Pure Play’ Silver Projects

Source: Rick Mills for Streetwise Reports   03/08/2021

Rick Mills of Ahead of the Herd delves into the investment metrics of the silver market and explains why he thinks Dolly Varden’s prospect is a good bet.

“Native silver,” found in the Earth’s crust on its own, is relatively rare. More commonly, it is mined alongside gold, or as a byproduct of zinc-lead ore. There are currently only 75 “pure play” silver companies, most of whom have projects in Chile, Argentina, Mexico and Peru.

The rarity of silver and gold becomes apparent when we consider how little of both have been mined throughout history—just 190,000 tonnes of gold and 1.6 million tonnes of silver. Or, in ounce (oz) terms, 6.1 billion oz of gold and 51.3 billion oz of silver. All the gold ever mined in the world could fit into a cube 21.6 meters on each side, and all the above-ground silver could fit into a 55m cube.


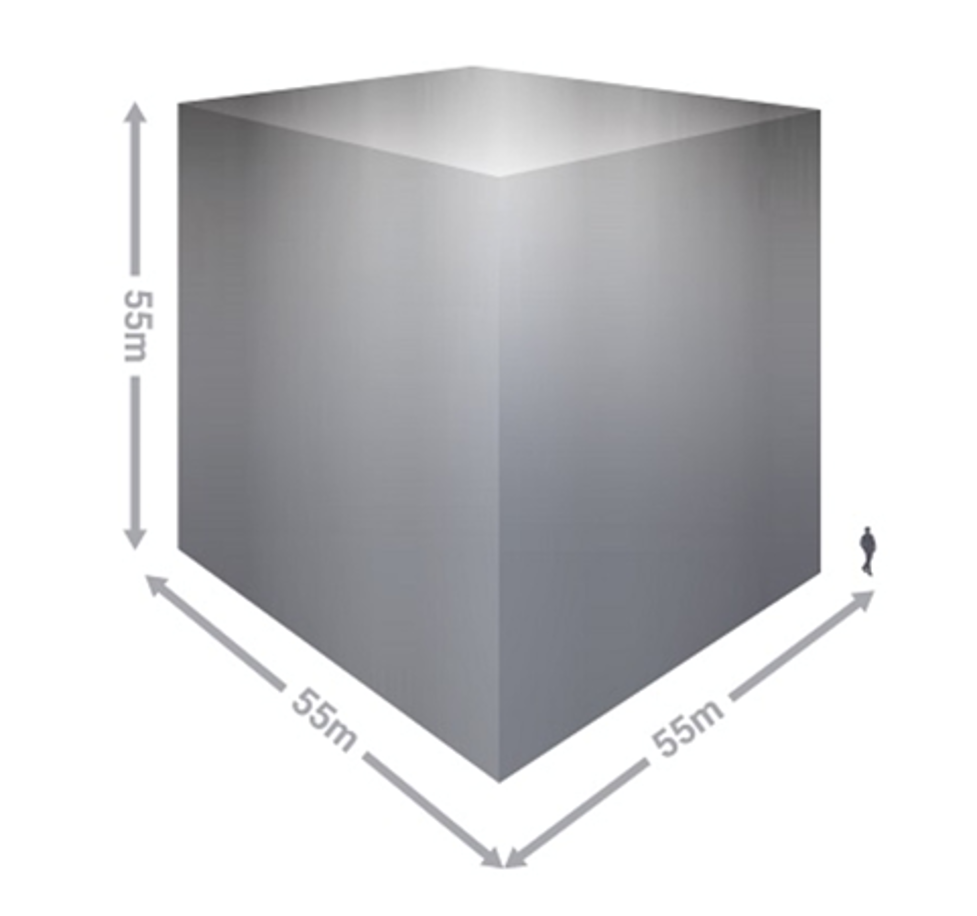
All of the above-ground silver could fit into a 55-meter cube.

While most of the world’s mined gold is still around, either cast as jewelry, or smelted into bullion and stored for investment purposes, the same cannot be said for silver. It’s estimated that 60% of silver is utilized in industrial applications, leaving only 40% for investing. Of the 60% used for industrial applications, almost 80% ends up in landfills.

Despite silver being about 17.5 times more plentiful than gold in the Earth’s crust, silver and gold have roughly the same amount, ~2.5 billion ounces, available for investment purposes. However, since very little gold is used by industry, it trades as an investment commodity—prices moving up and down in relation to factors like the U.S. dollar, inflation, interest rates and sovereign bond yields.

In comparison, silver commands a relatively small amount for investment, just 40% of supply. Because over half of supply is needed for industrial applications, silver trades more like an industrial metal than an investment commodity.

This also explains silver’s volatility. Because the investment market for silver is so small (60% is locked up in industrial uses) prices swing up and down wildly, at relatively low volumes. For this reason, investors nicknamed silver “the devil’s metal.”

Silver prices

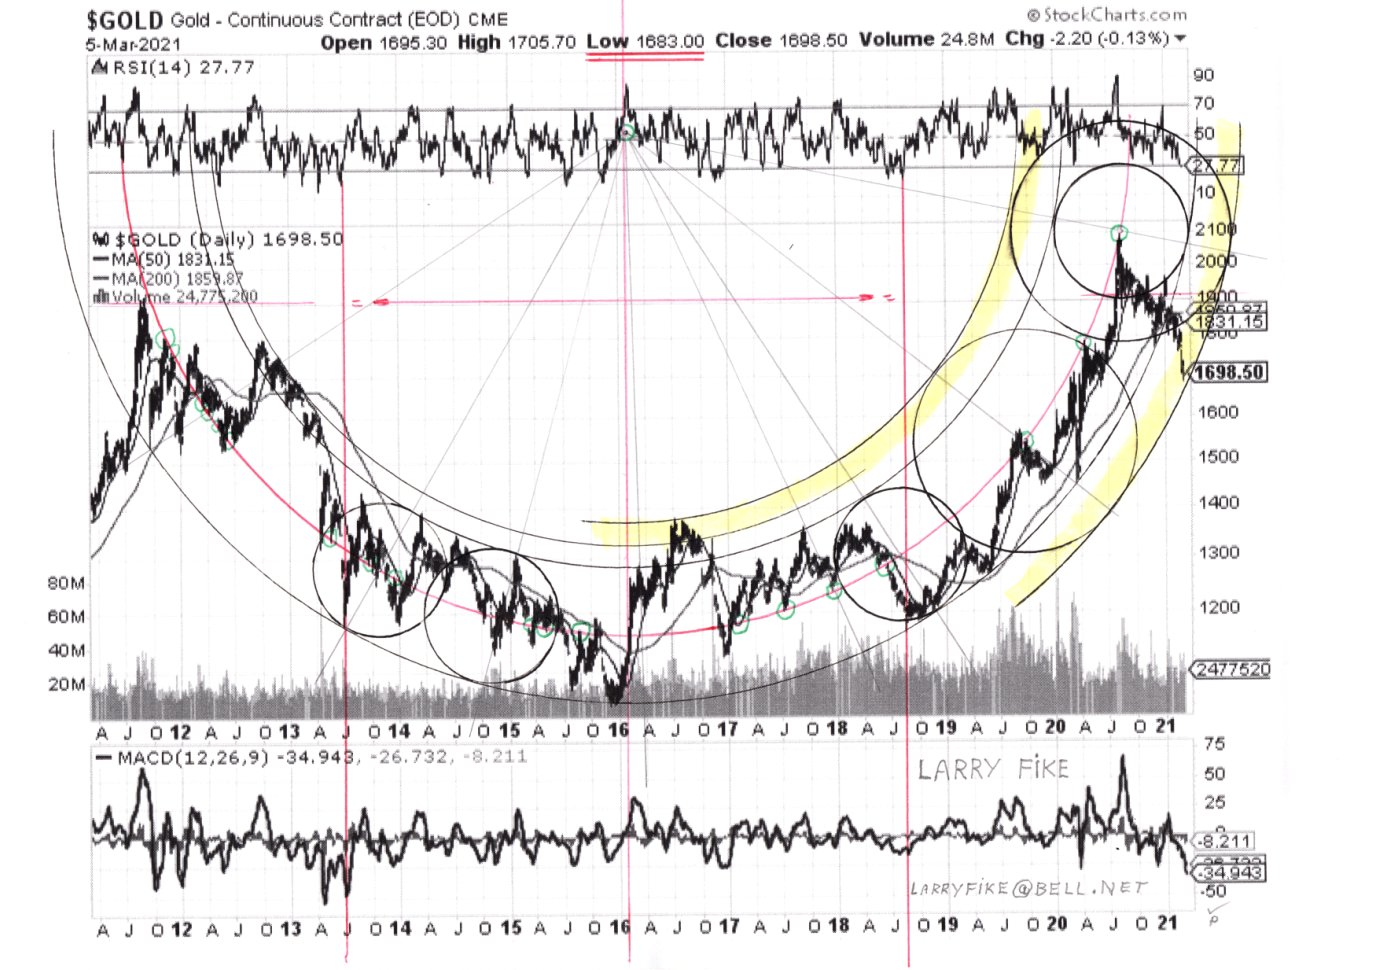
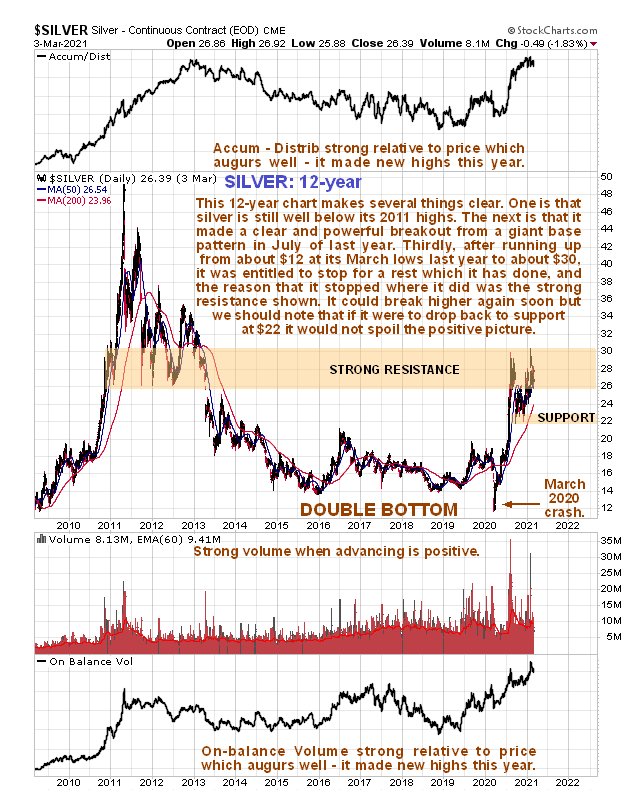
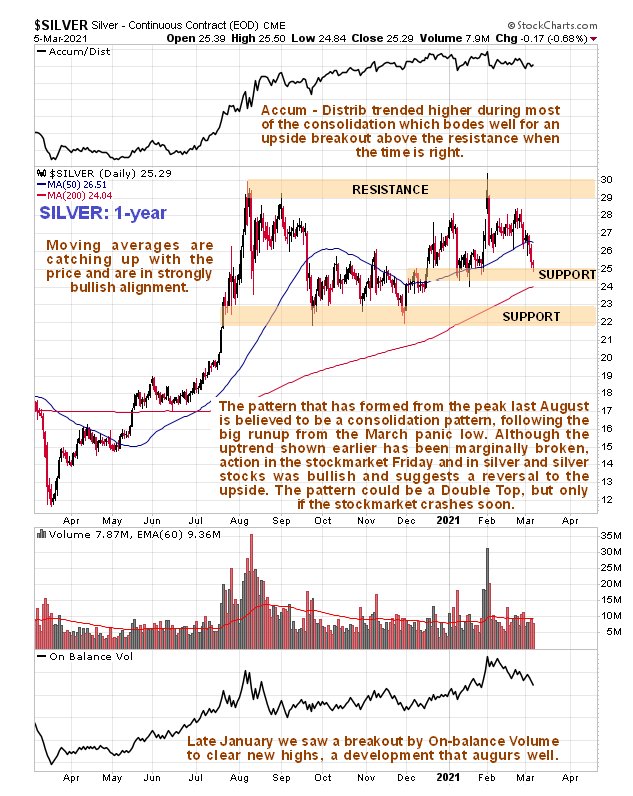
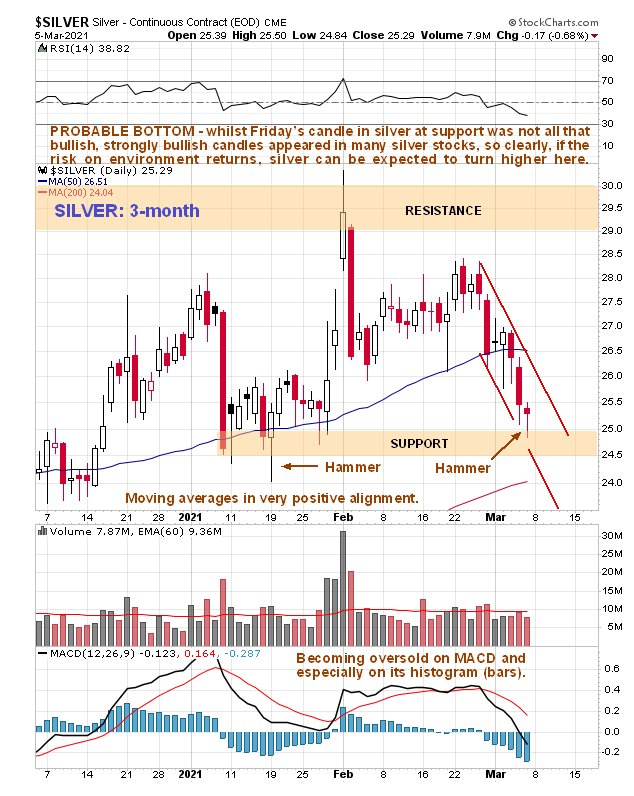
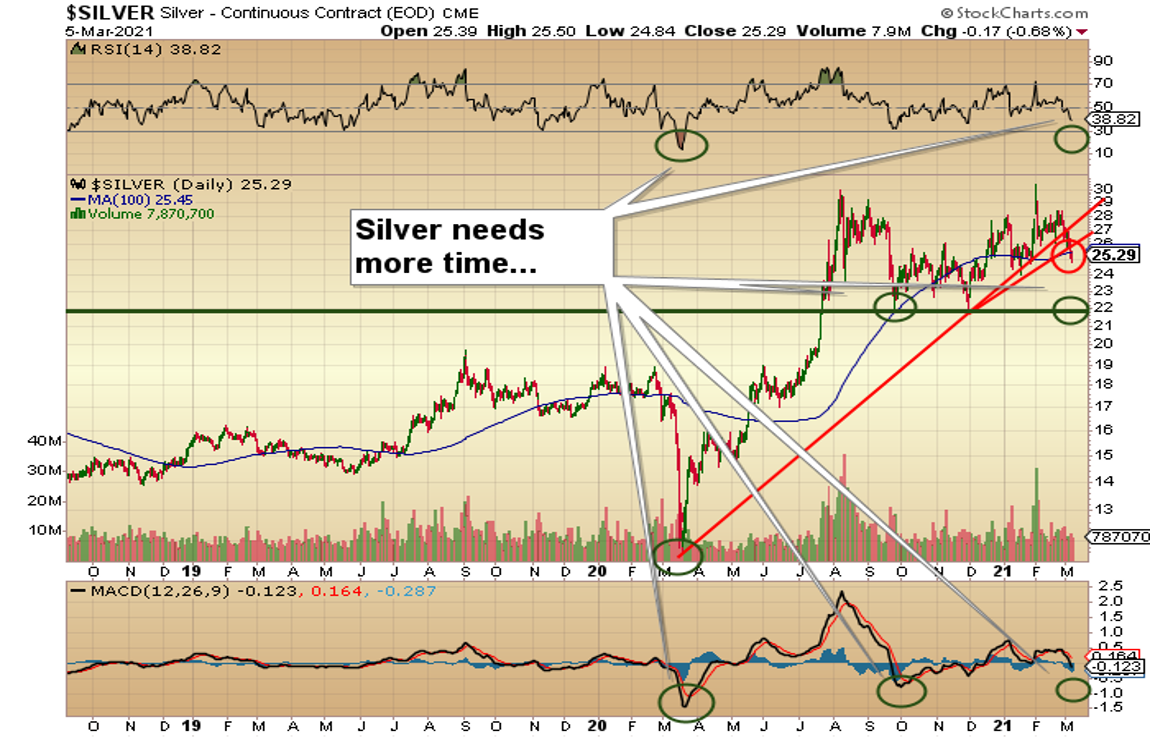
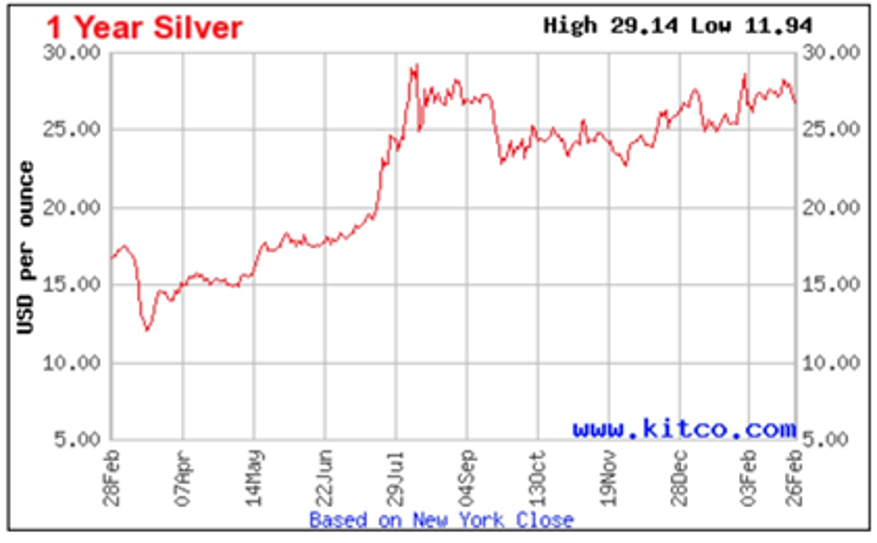
Silver last summer gained an astonishing 35%, as investors sought shelter from pandemic turmoil and low interest rates, while industrial demand for the metal recovered in some parts of the world. Its July performance, seen in the 1-year chart below, made silver the darling of the commodities complex.

The story behind its success—we were among the first to predict the potential for a silver breakout—was one of two demands, reflecting silver’s role as both a monetary and an industrial metal. There was also a supply narrative to silver’s rise, with respect to COVID-related output reductions at silver mines in Peru and Mexico, from which 40% of the world’s silver is produced.

Silver jumped to $28.32/ounce in August 2020, its best performance in seven years, and though prices retreated last fall, silver bounced higher in December, finishing the year up an impressive 46%, more than doubling gold’s 22% gain.

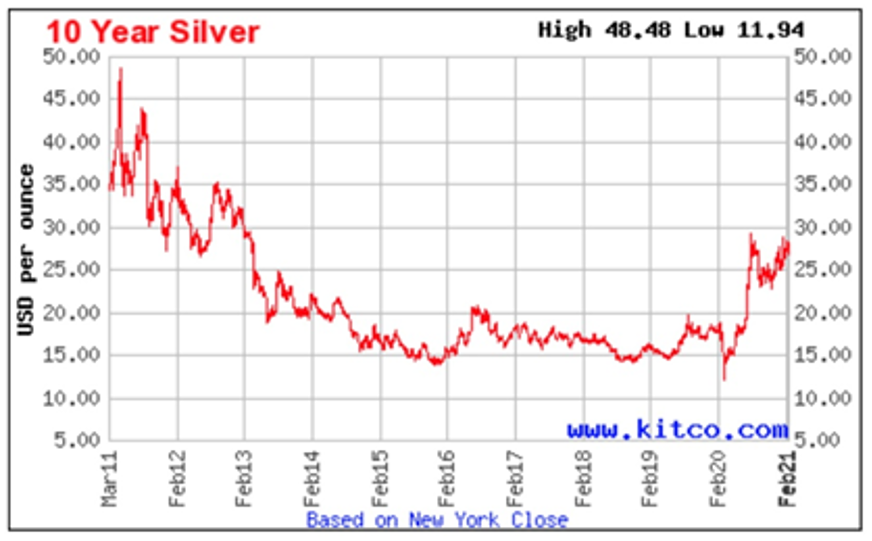
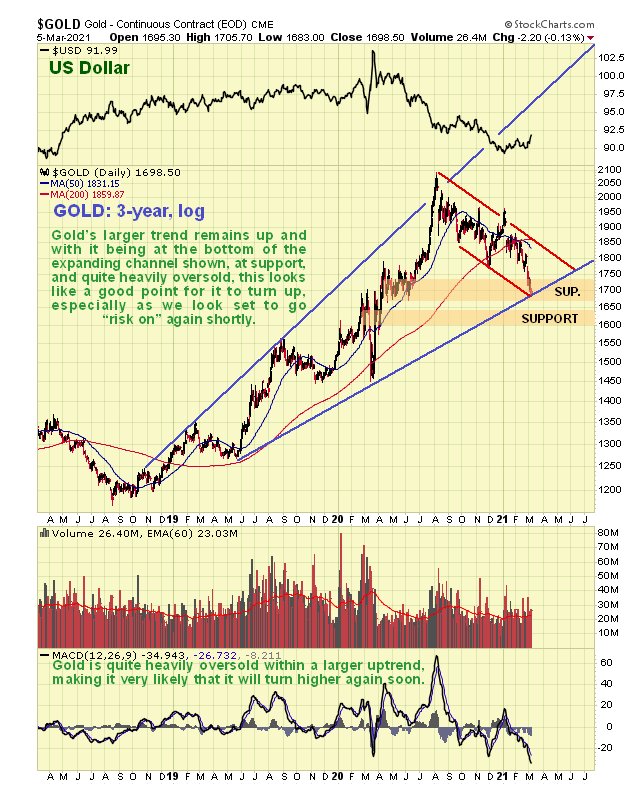
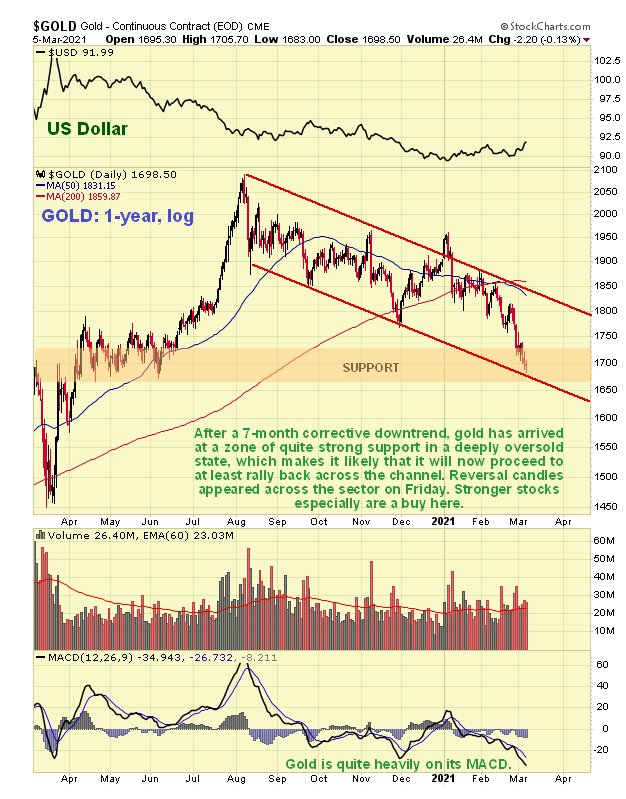
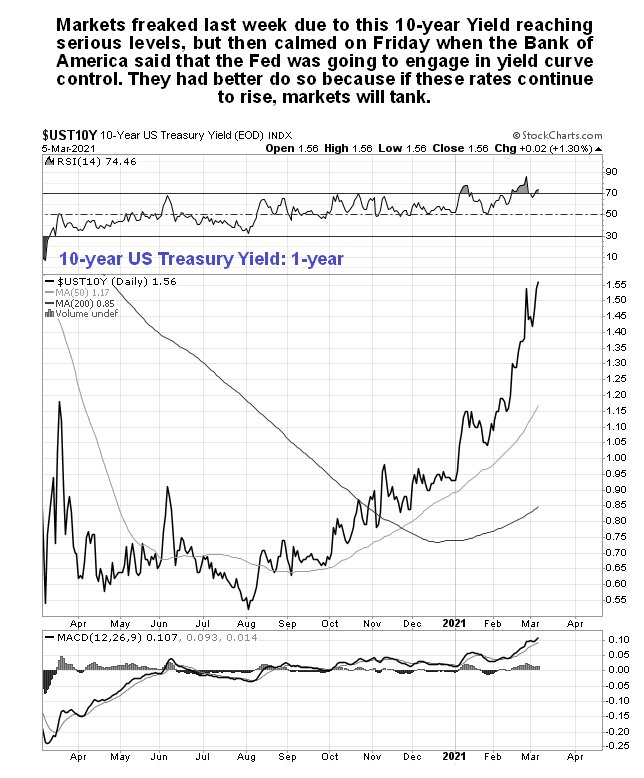
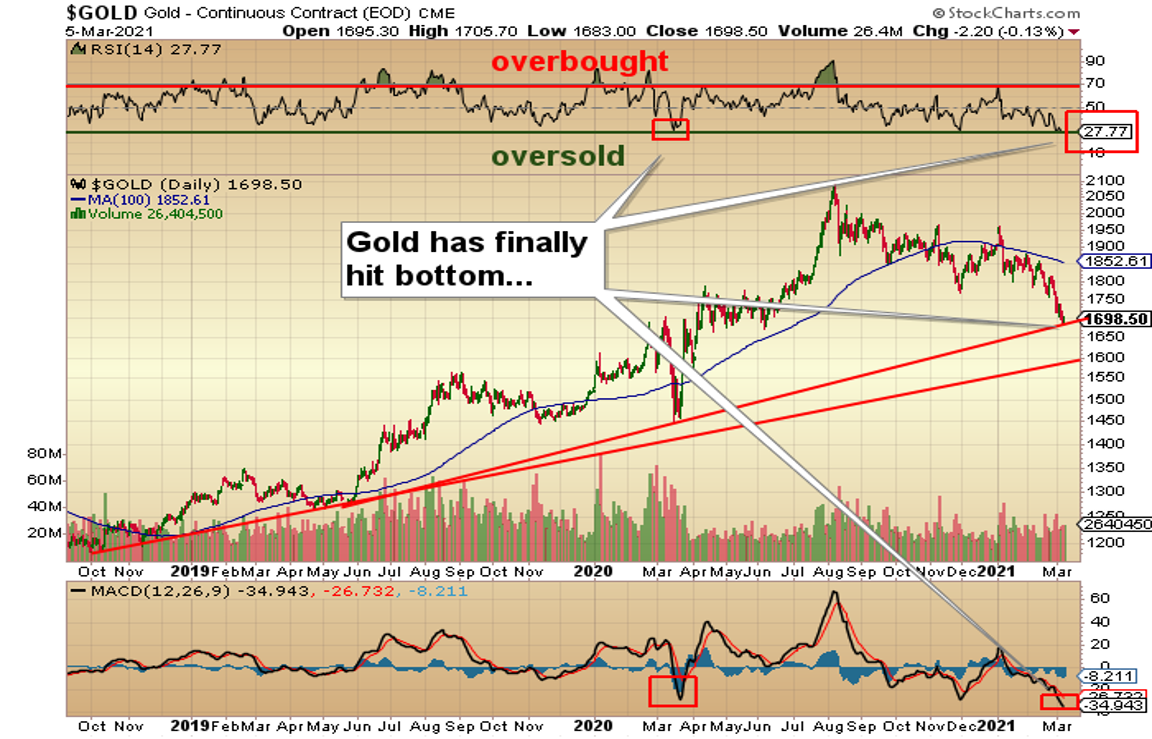
Despite pulling back in January and February, due mostly to expectations of better economic conditions and the recent rise in sovereign bond yields (ie. US Treasuries), silver and gold prices are expected to recover.

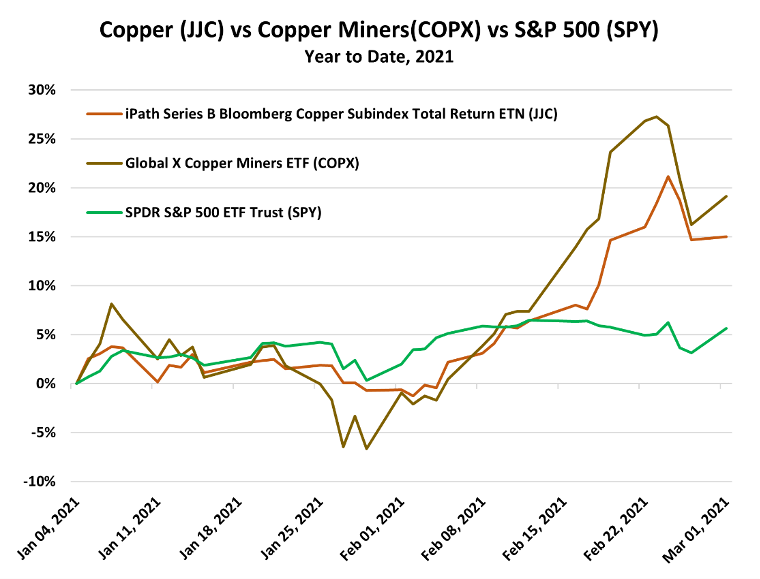
We know from previous articles that certain metals have done very well under government-mandated COVID restrictions. In countries where the virus got into the mining workforce, mines were shut down temporarily, impacting 2020 production. This happened in South America, including top copper producers Chile and Peru, and the number 1 silver mining country, Mexico. When combined with robust demand from China, the top metals consumer, the prices of copper, silver, zinc and nickel, just to name a few, had nowhere to go but up.

The silver outlook is extremely positive due to tight supply, combined with strong monetary and industrial demand drivers.

Hey Big Spender

The American government has already spent $4.5 trillion on COVID, not including the $1.9 trillion aid package currently before Congress, and the Federal Reserve has added around $7 trillion to its balance sheet.

To pay for these expenditures, the Fed printed so much money that the M2 money supply increased the most since 1943—when the U.S. was at war with Nazi Germany and tripled its military spending.

The national debt is $28 billion and clearly going higher, with most of the spending promises not yet put into action.

President Biden’s economic recovery package, expected to be unveiled this month, has as its centerpiece the biggest infrastructure spending commitments since Roosevelt’s New Deal. It includes roads, bridges and broadband internet access, with progressive Democrats eyeing much more, ie., an expansion of Obamacare and a public sector jobs program.

When campaigning for president, Biden proposed $2 trillion for economic rebuilding, so we expect the infrastructure bill to contain at least that much.

Then there’s his Clean Energy Plan, another $2 trillion program, to decarbonize U.S. electricity in 15 years, and create a net zero-emissions economy by 2050.

This big-spending environment is bound to be good for gold and silver prices. Not only is it inflationary, on the scale of historical spending imperatives like the New Deal of the 1930s or the Second World War, but the kind of spending we are talking about will increase the debt-to-GDP (gross domestic product) ratio, and lower the U.S. dollar (in an earlier article, we showed the close relationship between debt-to-GDP ratios and gold).

Supply Deficit

The two waves of COVID-19 that hit Latin America last year, impacted some of the biggest silver mines in the world.

In Peru, among the companies affected were Trevali Mining Corp. (TV:TSX; TV:BVL; TREVF:OTCQX) and its Santander silver mine, Hochschild Mining Plc’s (HOC:LSE) Inmaculada, and Fortuna Silver Mines Inc.’s (FSM:NYSE; FVI:TSX; FVI:BVL; F4S:FSE) Caylloma.

Investment projects such as Anglo American Plc’s (AAUK:NASDAQ) $5 billion Quellaveco, Minsur’s $1.6 billion Mina Justa and Chinalco Mining Peru’s $1.5 billion Toromocho expansion were delayed.

In Mexico, the world’s largest silver producer, a surge of COVID-19 cases last March led to the suspension of non-essential services. Among the companies forced to temporarily halt their operations, were Newmont Corp. (NEM:NYSE), Argonaut Gold Inc. (AR:TSX), Pan American Silver Corp. (PAAS:TSX; PAAS:NASDAQ), Sierra Metals Inc. (SMT:TSX), Excellon Resources Inc. (EXN:TSX; EXLLF:OTCPK) and Alamos Gold Inc. (AGI:TSX; AGI:NYSE).

As a result of COVID, the Silver Institute predicted a 13% decline in silver production from Latin America in 2020—equivalent to 67 million fewer ounces. The global tally amounted to 6% fewer ounces mined last year compared to 2019, according to the U.S. Geological Survey (25,000 tonnes vs 26,500 tonnes).
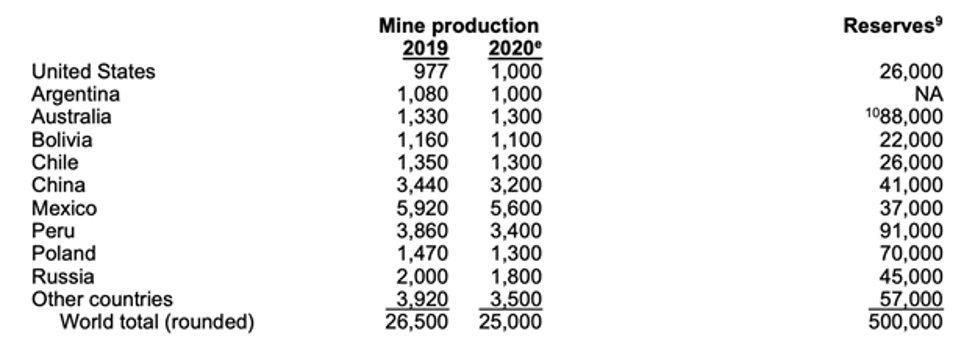

Source: USGS

Given supply and demand factors, Capital Economics estimates the silver market will remain in a small deficit, right through to 2022.

Industrial Demand Drivers

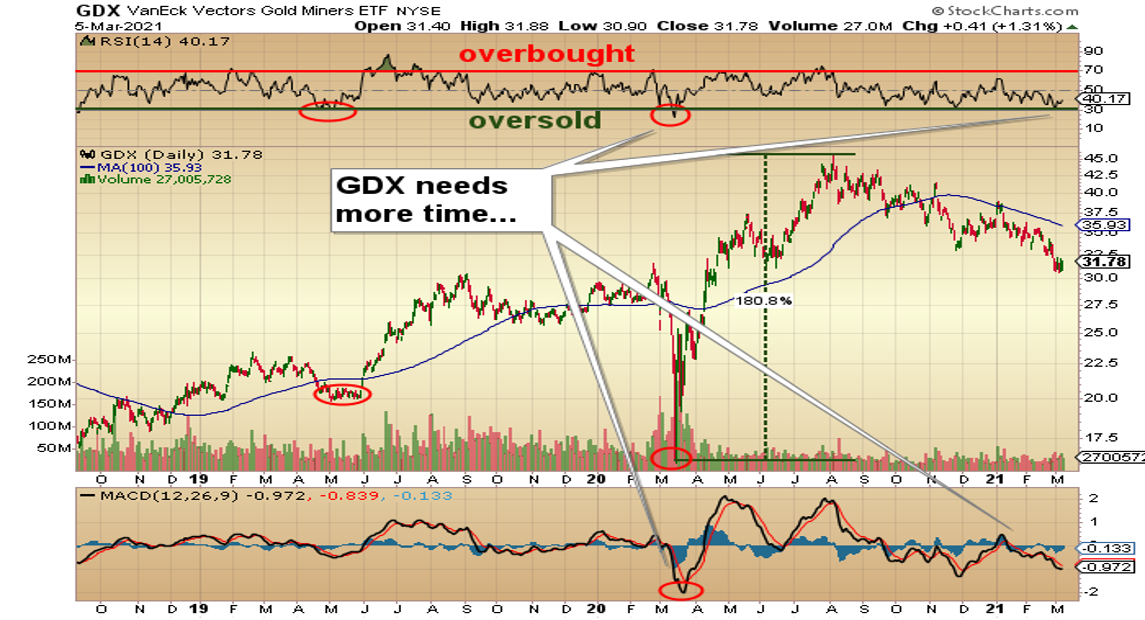
When gold prices approach or retake highs reached last summer, silver prices will likely follow; the white metal’s dual-demand drivers, being both a monetary and an industrial metal, has some analysts predicting it will outperform gold in 2021.

Analysts at Capital Economics think silver prices should gain momentum on the back of ongoing fiscal stimulus in China, and greater industrial activity which drives around half of annual silver consumption. They point out the latter will be helped by governments investing in green energy, including solar panels which contain silver paste.

The solar power industry currently accounts for 13% of silver’s industrial demand.

More and more silver will be demanded for its use in solar photovoltaic (PV) cells, as countries move further toward adopting renewable energy sources. Around 20 grams of silver are required to build a solar panel. The Silver Institute predicts 100 gigawattas of new solar facilities will be constructed per year between 2018 and 2022, which would more than double the world’s 2017 capacity of 398GW.

All that solar will be a major boon for silver.

CRU expects PV manufacturers to consume 888 million ounces of silver between now and 2030. That’s 51.5 million oz more than the combined output from all the world’s silver mines in 2019.

5G technology is set to become another big new driver of silver demand.

Among the 5G components requiring silver, are semiconductor chips, cabling, microelectromechanical systems (MEMS), and Internet of Things (IoT)-enabled devices.

The Silver Institute (SI) expects silver demanded by 5G to more than double, from its current ~7.5 million ounces (Moz), to around 16 Moz by 2025 and as much as 23 Moz by 2030, which would represent a 206% increase from current levels.

A third major industrial demand driver for silver is the automotive industry. While copper and battery metals are usually thought of as the main beneficiaries of electrification, it appears the white metal will get swept up in the EV growth story. SI anticipates that, due to the evolution of hybrid and battery electric vehicles, the auto industry is expected to absorb 90 million ounces of silver by 2025, rivaling silver consumption in photovoltaics, currently the largest application of global industrial silver demand at 98 Moz this year. Automotive demand in 2021 is projected at 61 Moz.

A recent Silver Institute report says battery electric vehicles contain up to twice as much silver as ICE-powered vehicles, with autonomous vehicles requiring even more due to their complexity. Charging points and charging stations are also expected to demand a lot more silver.

Golden Triangle

While most of the world’s silver (Ag) is mined in Latin America and China, British Columbia should not be overlooked as a past and future Ag producer. The province is endowed with one of the richest mineralized regions on the planet, in the Golden Triangle of northwestern BC.

With over a century of mining history, the triangle has been the site of three gold rushes and some of Canada’s greatest mines, including Premier, Snip and Eskay Creek. Other significant and well-known deposits include Brucejack, Galore Creek, Copper Canyon, Schaft Creek, KSM, Granduc and Red Chris.

The Golden Triangle takes its name from a 500-kilometer belt of mineralization that stretches from the British Columbia-Yukon border in the north, to the town of Kitsault, just southeast of the port of Stewart, BC. The Kitsault area is historically associated with molybdenum and silver production.

When production started at Eskay Creek in 1994, it was the highest-grade gold mine in the world. The operation produced over 3 million ounces of gold at an average grade of 45 grams per tonne (g/t), and 160 million ounces of silver, at 2.2 g/t, before shutting down in 2008. However, the ore that has been left is valuable. A recent PEA (preliminary economic assessment) shows a 4 Moz gold-equivalent resource grading 4.4 g/t, which is quite high grade for an open pit.

Seabridge Gold Inc.’s (SEA:TSX; SA:NYSE.MKT) KSM is considered the world’s largest undeveloped gold-copper porphyry deposit. It hosts 38.8 million ounces of gold and 10.2 billion pounds of copper in reserves, with an initial 44-year mine life production plan. The project spans four deposits: Kerr, Sulphurets, Mitchell and Iron Cap.

The Brucejack Mine commenced production in 2017 and, at 16.1 g/t, is one of the highest-grade gold mines to have opened in recent years. The underground gold and silver mine has estimated reserves of 4.2 million gold ounces, and a mine life of 13 years.

Other large deposits/mines worth mentioning include Schaft Creek, a joint venture between Teck Resources Ltd. (TCK:TSX; TCK:NYSE) and Copper Fox Metals Inc. (CUU:TSX.V) that hosts Proven and Probable reserves of 5.6 billion pounds of copper, 6 Moz of gold and 52 Moz of silver; and Red Chris, an open pit mine developed by Imperial Metals Corp. (III:TSX). Imperial opened the mine in 2015 and sold it four years later to Australian gold miner Newcrest Mining Ltd. (NCM:ASX), for $804 million. According to Imperial, Red Chris produced 71.9 million pounds of copper in 2019, 36,741 ounces of gold, and 133,879 oz of silver in 2019, and will keep producing until at least 2043.

Lately there has been a resurgence of interest in the Golden Triangle, with the excitement driven by:

  • New road, power and port infrastructure built by the BC government
  • Receding glaciers revealing fresh mineralization
  • Improved relationships between mining/exploration companies, the BC government and the region’s two First Nations groups
  • New technologies allowing geologists to gain a better understanding of the Golden Triangle’s complex geology

The rocks underlying the triangle host a variety of mineral deposits, including gold, silver, copper and molybdenum. Situated within the Sulphurets Hydrothermal System, known to host one of the world’s largest concentrations of metals, the Golden Triangle contains an estimated 188 million ounces of gold reserves, including 47.5 million in the highly certain proven and probable category; 1.2 billion ounces of silver with 214 Moz proven and probable; and 55 billion pounds of copper of which 10B is proven and probable.

Geologists believe most of the mineralization was formed because of volcanism during the Late Triassic and Early Jurassic periods. Importantly, all the mineral deposits have one characteristic in common: they are all found near surface, at depths no greater than 2,500 meters. This allows for relatively easy access, especially with the help of receding glacial ice cover.

Dolly Varden Silver Corp. (DV:TSX.V; DOLLF:OTCMKTS)

The story of Dolly Varden Silver’s involvement in the Golden Triangle, particularly the area south of Stewart, began in 1910, when the Dolly Varden Mine was discovered by prospectors of Scandinavian descent.

Its namesake project is a volcanogenic massive sulfide (VMS) and epithermal-style pure silver deposit, with a small amount of lead and zinc.

The Dolly Varden properties, consisting of two past-producing silver deposits, became part of British Columbia’s mining lore, featuring assays as high as 2,200 ounces (over 72 kg) silver per ton, with historical production of 20 million ounces Ag, between 1919 and 1959.

In fact, the Dolly Varden/North Star Mine was among the richest silver mines in the British Empire, producing 1.3 Moz at an average grade of 1,109 g/t Ag between 1919 and 1921. An interesting historical tidbit: The mine was opened by mining engineer Herbert Hoover, who would go on to become U.S. President.

In 1956, the Torbrit Mine was the third largest silver producer in Canada, outputting 18 Moz at 466.3 g/t Ag, plus base metal credits, between 1949 and 1959, when the mine closed. A large part of the Torbrit deposit was left intact due to silver prices falling below $0.85/ton.

Dolly Varden’s goal is to try and extend Torbrit through some step-out drill holes, and to get into the high-grade, 500g to 1kg material. There are early indications of other Torbrit “look-alikes” along a 4.5-km trend. Through drilling, Dolly Varden wants to prove up another Torbrit and drastically increase the size of the resource, which in all categories is about 44 Moz at an average grade of 300 g/t.

A key part of the exploration thesis is the fact that the rocks hosting the mineralization on the property are the same age as some of the other large deposits found in the Golden Triangle including Eskay Creek.

“The exciting thing about the Dolly Varden project is that it is hosted in the Hazelton formation, a Jurassic package of volcanic rocks that went through the same expansion or release of pressure called the Eskay Rift period,” says head geologist Rob van Egmond, in a recent AOTH video interview. “That was the time frame when a lot of the metallogenic deposits throughout the whole Golden Triangle were emplaced, such as Eskay Creek. After that rifting there was a compressional period which formed a lot of the structures that host the epithermal veins. And a lot of those epithermal veins were probably active to form the deposits that were on the seafloor, VMS-style.”

CEO Shawn Khunkhun likes to compare Dolly Varden Silver to Skeena Resources Ltd. (SKE:TSX.V), which has seen a significant re-rating commensurate with its success so far in developing the historical Eskay Creek Mine.

“Our story is very similar,” he says. “They’re awakening Eskay Creek, we’re re-awaking the Dolly Varden silver mine. It’s got a rich history, it’s one of the richest silver mines in the world, it’s produced 20 million ounces of high-grade silver, and we’re endowed with 44 million ounces in a cornerstone high-grade pure silver resource, and we’ve got a technical team that has the ability to unlock further discoveries in this trend.”

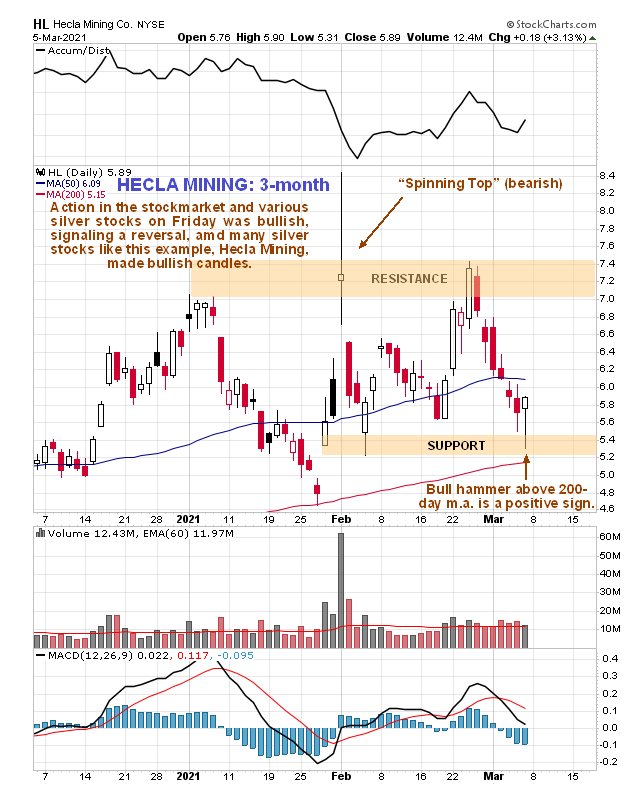
Last year the company raised $27 million through two tranches ($2.5M from Hecla Canada, a major shareholder with 11% ownership.) Eric Sprott soaked up CA$2.3 million of a $0.33 financing, the billionaire resource investor upping his stake in Dolly Varden (DV) to 19.9%. Institutional investors have come into DV in a big way—they own 50% of the 129.9 million shares outstanding (144.4 million fully diluted) and include Frank Holmes’ US Global Investors and Sprott Asset Management.

It’s unusual for a junior Dolly Varden’s size to be so tightly held by institutional and notable shareholders. In fact, when all is said and done, retail only owns 12%.

Emerging Silver District?

The Dolly Varden project comprises 8,800 hectares (88 square km) in the Stewart Complex of northwestern BC, which hosts base and precious metals deposits. The property has four historically active mines—Dolly Varden, Torbrit, North Star and Wolf.

On the map below, note that Dolly Varden’s project is in the bottom corner of the Golden Triangle. It lies to the west of Hecla Mining’s (HL:NYSE) Kinskuch project, and borders Fury Gold Mines’ (FURY:TSX) Homestake Ridge, where a PEA envisions a 13-year mine with peak annual production of just over 88,000 gold-equivalent ounces. More than 275 holes totaling over 90,000 meters have been completed on the Dolly Varden? or Homestake? property.

Hecla’s Kinskuch is an early-stage project with the potential for discovery of epithermal silver-gold, gold-rich porphyry and VMS deposits.

According to Dolly Varden Silver, only 3% of the Dolly Varden property has been explored in detail, leaving tons of upside for shareholders.

“Despite the long production history and exploration history we’re still making new discoveries,” says van Egmond. “We’ve done structural re-interpretation of the whole project, and we’ve drilled across faults and found offsets to the main Torbrit deposit, within 50m of the old drilling from the ’50s. So, there’s still a lot of exploration upside near deposit, as well as all the way up the trend to the northern end of the property, we have four and a half kilometers of these Hazelton rocks with a strong potassic alteration signature, as well as sodium depletion, so that’s indicative of VMS heat cells working within that alteration, so we look forward to exploring up the rest of that belt.”

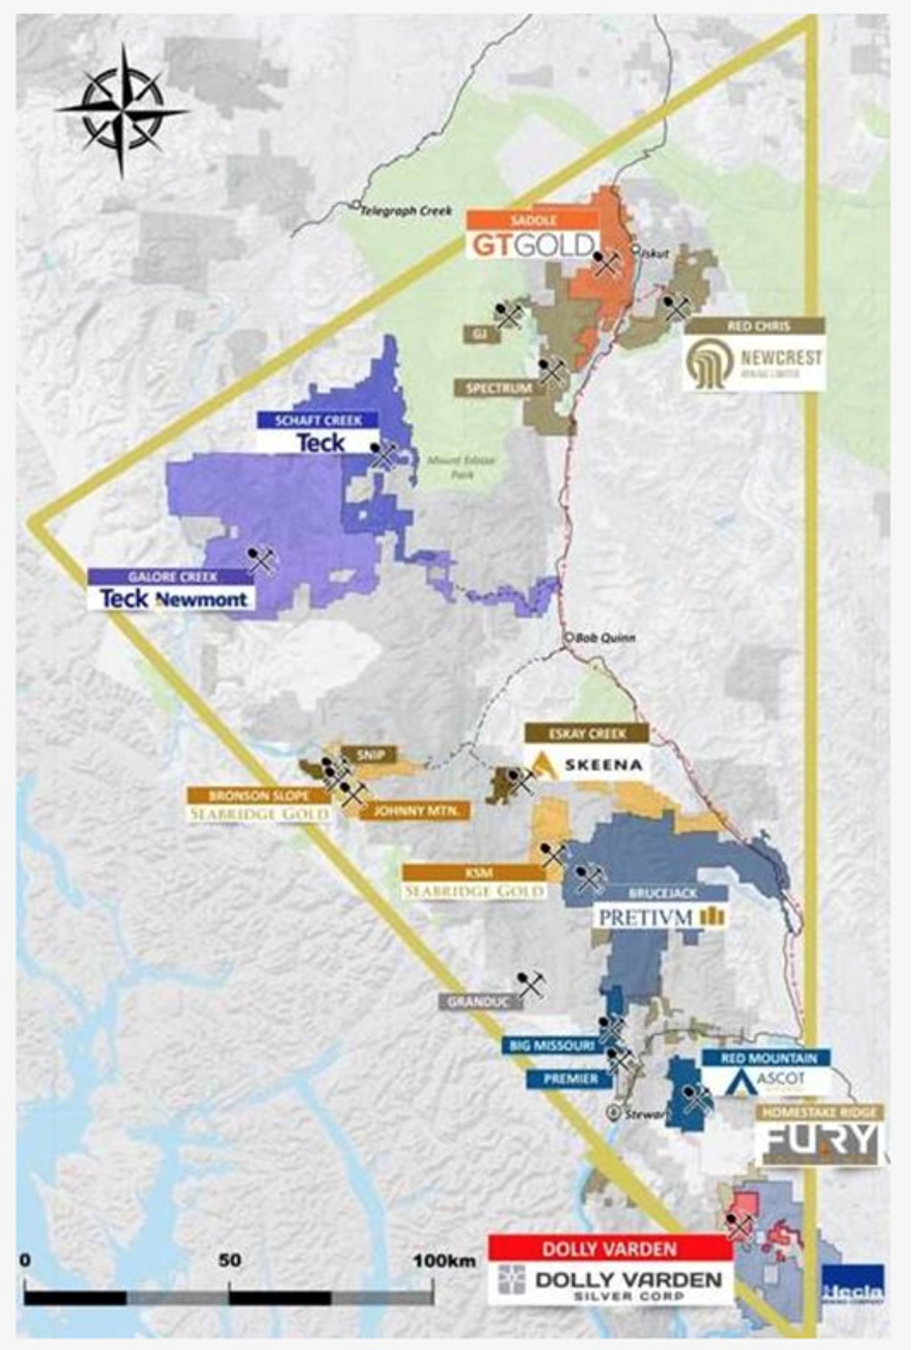
Map of BC’s Golden Triangle region, with Dolly Varden’s property in the
bottom corner.

An updated NI 43-101 resource estimate completed by Dolly Varden in 2019 revealed 32.9 Moz silver in Indicated resources and 11.477 Moz Inferred, adjacent to the historical deposits. Drilling and underground work that went into the resource estimation confirmed that the mineralization occurs as two styles: bedding-parallel VMS, similar to that mined at Eskay Creek, as well as cross-cutting epithermal mineralization similar to that being developed at Pretium Resources Inc.’s (PVG:TSX; PVG:NYSE) Valley of the Kings deposit (Brucejack Mine).

According to DV, both the Eskay Creek and Valley of the Kings deposits are located on the same structural trend to the north of Dolly Varden’s ground. Dolly Varden represents the silver end of these styles of mineralization and includes the base metals lead and zinc.

Could Dolly Varden represent the southern end of a silver district that extends northward? It seems likely and further exploration may prove it.

2020 Drill Results

Over the past three years, structural re-interpretation and aggressive drill testing have yielded new discoveries of high-grade silver mineralization proximal to areas with 100 years of exploration history. Since 2017, Dolly Varden has drilled over 66,000 meters in 213 holes.

Last October, Dolly Varden published results from 2020 exploration, which included step-out drilling at the Torbrit Mine, and infill drilling to expand the high-grade zones within the deposit. The step-out highlights were 351 g/t over 12.75m, including a higher-grade 1,083 g/t Ag intercept over 2.7m; and 135 g/t Ag over 37.5m, including 906 g/t over 1m. The best infill drill hole featured 302 g/t Ag over 31.95m, including 642 g/t Ag over 4m.

A total of 11,397 meters in 40 drill holes were completed in 2020, 19 of which were in the Torbrit area. The rest were reconnaissance and exploration drill holes, testing multiple areas on the property.

In February, the rest of the assays came in, with highlights that included 310 g/t over 6 meters, a standout 304 g/t over 45.82m, and 306 g/t over 5.10m. Higher-grade core within those intercepts featured 648 g/t over 6.06m, 1,595 g/t over 1.06m, and 1,290 g/t over 0.6m.

“We are seeing consistent intervals of high-grade silver mineralization at the Torbrit Silver deposit that has the potential to support economically attractive underground bulk-mining technics, while at the same time each successive drill programs continues to demonstrate that the deposit is open for expansion,” states CEO Shawn Khunkhun, in the Feb. 16 news release.

He adds that the company “cannot rule out a gold discovery consistent with the plus million-ounce resource at the adjacent Homestake property in addition to the potential for another Torbrit like silver discovery,” given encouraging geological and geochemical results for gold and copper mineralization from the four-kilometer-long trend to the northwest of the silver deposits.

Conclusion

Dolly Varden is conducting exploration in the Golden Triangle at the perfect time for the silver market, which, as mentioned, is supporting higher prices, and a renewed sense of purpose, as an essential metal for the modern economy.

Unlike its sister precious metal, gold, silver has both a monetary and an industrial function, meaning that prices can move on demand drivers that mesh with the prevailing trends of the modern industrialized world. For silver, that means the growth of solar power (photovoltaics), electric vehicles, and 5G.

As the prospects for economic growth continue to brighten, as vaccine rollouts accelerate, we expect silver prices to catch a bid on strengthened industrial demand. And with trillions of dollars in new government spending related to economic stimulus and recovery, about to be unleashed in the United States alone, precious metals will surely react to inflationary concerns, especially considering that the Federal Reserve is severely restricted in how high it can raise interest rates to cool the economy. The Fed has already stated it will let inflation run higher to accelerate growth and bring down record-high unemployment, and expects to keep interest rates close to zero for the next two years—both policies are good for precious metals.

Dolly Varden is a tightly held stock—85% of the outstanding shares are with insiders, Hecla Mining, Eric Sprott and institutional investors—that is well financed and comes with a strong management and technical team. The company finds itself in the rare position of being a pure-play silver explorer, in a space where most silver production comes from lead-zinc deposits or is a by-product of gold mining.

This makes Dolly Varden the perfect vehicle for rising silver prices.

Dolly Varden Silver Corp.
TSXV:DV, OTC:DOLLF
CA$0.69/share, 2021.03.01
Shares Outstanding 126,022861M
Market cap CA$89.6M
DV website

Richard (Rick) Mills
subscribe to my free newsletter
aheadoftheherd.com
Ahead of the Herd Twitter

Richard (Rick) Mills, AheadoftheHerd.com, lives on a 160-acre farm in northern British Columbia. Richard’s articles have been published on over 400 websites, including: Wall Street Journal, USA Today, National Post, Lewrockwell, Montreal Gazette, Vancouver Sun, CBSnews, Huffington Post, Beforeitsnews, Londonthenews, Wealthwire, Calgary Herald, Forbes, Dallas News, SGT report, Vantagewire, India Times, Ninemsn, Ib times, Businessweek, Hong Kong Herald, Moneytalks, SeekingAlpha, BusinessInsider, Investing.com, MSN.com and the Association of Mining Analysts.

Sign up for our FREE newsletter at: www.streetwisereports.com/get-news

Disclosures:
1) Rick Mills: I, or members of my immediate household or family, own shares of the following companies mentioned in this article: None. I personally am, or members of my immediate household or family are, paid by the following companies mentioned in this article: None. My company currently has a financial relationship with the following companies mentioned in this article: Dolly Varden Silver is an advertiser on Ahead of the Herd. I determined which companies would be included in this article based on my research and understanding of the sector. Additional disclosures/disclaimer below.
2) The following companies mentioned in this article are sponsors of Streetwise Reports: Dolly Varden Silver, Seabridge Gold and Pretium Resources. Click here for important disclosures about sponsor fees.
3) Comments and opinions expressed are those of the specific experts and not of Streetwise Reports or its officers. The author is wholly responsible for the validity of the statements. The author was not paid by Streetwise Reports for this article. Streetwise Reports was not paid by the author to publish or syndicate this article. The information provided above is for informational purposes only and is not a recommendation to buy or sell any security. Streetwise Reports requires contributing authors to disclose any shareholdings in, or economic relationships with, companies that they write about. Streetwise Reports relies upon the authors to accurately provide this information and Streetwise Reports has no means of verifying its accuracy.
4) The article does not constitute investment advice. Each reader is encouraged to consult with his or her individual financial professional and any action a reader takes as a result of information presented here is his or her own responsibility. By opening this page, each reader accepts and agrees to Streetwise Reports’ terms of use and full legal disclaimer. This article is not a solicitation for investment. Streetwise Reports does not render general or specific investment advice and the information on Streetwise Reports should not be considered a recommendation to buy or sell any security. Streetwise Reports does not endorse or recommend the business, products, services or securities of any company mentioned on Streetwise Reports.
5) From time to time, Streetwise Reports LLC and its directors, officers, employees or members of their families, as well as persons interviewed for articles and interviews on the site, may have a long or short position in securities mentioned. Directors, officers, employees or members of their immediate families are prohibited from making purchases and/or sales of those securities in the open market or otherwise from the time of the interview or the decision to write an article until three business days after the publication of the interview or article. The foregoing prohibition does not apply to articles that in substance only restate previously published company releases. As of the date of this article, officers and/or employees of Streetwise Reports LLC (including members of their household) own securities of Fortuna Silver and Pretium Gold, companies mentioned in this article.

Charts and graphics provided by the author.

Legal Notice / Disclaimer: Ahead of the Herd newsletter, aheadoftheherd.com, hereafter known as AOTH. Please read the entire Disclaimer carefully before you use this website or read the newsletter. If you do not agree to all the AOTH/Richard Mills Disclaimer, do not access/read this website/newsletter/article, or any of its pages. By reading/using this AOTH/Richard Mills website/newsletter/article, and whether or not you actually read this Disclaimer, you are deemed to have accepted it.

Any AOTH/Richard Mills document is not, and should not be, construed as an offer to sell or the solicitation of an offer to purchase or subscribe for any investment.

AOTH/Richard Mills has based this document on information obtained from sources he believes to be reliable but which has not been independently verified. AOTH/Richard Mills makes no guarantee, representation or warranty and accepts no responsibility or liability as to its accuracy or completeness. Expressions of opinion are those of AOTH/Richard Mills only and are subject to change without notice. AOTH/Richard Mills assumes no warranty, liability or guarantee for the current relevance, correctness or completeness of any information provided within this Report and will not be held liable for the consequence of reliance upon any opinion or statement contained herein or any omission. Furthermore, AOTH/Richard Mills assumes no liability for any direct or indirect loss or damage or, in particular, for lost profit, which you may incur as a result of the use and existence of the information provided within this AOTH/Richard Mills Report.

AOTH/Richard Mills is not a registered broker/financial advisor and does not hold any licenses. These are solely personal thoughts and opinions about finance and/or investments – no information posted on this site is to be considered investment advice or a recommendation to do anything involving finance or money aside from performing your own due diligence and consulting with your personal registered broker/financial advisor. You agree that by reading AOTH/Richard Mills articles, you are acting at your OWN RISK. In no event should AOTH/Richard Mills liable for any direct or indirect trading losses caused by any information contained in AOTH/Richard Mills articles. Information in AOTH/Richard Mills articles is not an offer to sell or a solicitation of an offer to buy any security. AOTH/Richard Mills is not suggesting the transacting of any financial instruments but does suggest consulting your own registered broker/financial advisor with regards to any such transactions.

Richard does not own shares of Dolly Varden Silver Corp (TSX.V:DV). DV is a paid advertiser on his site aheadoftheherd.com.

( Companies Mentioned: DV:TSX.V; DOLLF:OTCMKTS,
)

Categories
Gold

Precious Metals Imports Into US Hit 19-Year High in 2020

Imports into the US of gold, silver and other precious metals surged last year. The value of precious metals pouring into the US hit a 19-year high in 2020 and doubled the volume of 2019, according to an analysis of census trade data by USA TODAY. The influx of precious metals into the US hit […]

The post Blog first appeared on SchiffGold.

Categories
Gold

Peter Schiff: The Fed Between a Rock and a Hard Place

The markets seem to think the Fed is going to fight inflation. They believe that the central bank will pivot to tighter monetary policy sooner than expected as inflation heats up, even though Jerome Powell keeps insisting inflation isn’t really a problem. In a recent podcast, Peter Schiff said that the truth is the Fed […]

The post Blog first appeared on SchiffGold.

Categories
Gold

Silver Retest Of $22 Coming?

Silver needs to return to its unassuming ways and rebuild the technical position, which it… by Michael Ballanger via Streetwise Reports “Today we’re still a long way from our goals […]
Categories
Gold

Silver: What Does it Mean to You?

Silver can be many things to many different people… By Matt from Silver Fortune via Silver Fortune Silver can be many things to many different people. What is it to […]
Categories
Gold

The V-Shaped Recovery Never Happened

The “V-shaped recovery” we were promised last spring never happened. It’s pretty clear the US is still very much in the midst of a jobs recession…  by Ryan McMaken of […]