Costco is limiting gold bar purchases as demand surges Yahoo Finance
Category: Gold
Source: Streetwise Reports 05/12/2025
Pan American Silver Corp. (PAAS:TSX; PAAS:NASDAQ) announces a definitive agreement to buy Tier 1 silver producer MAG Silver Corp. for US$2.1 billion. Read what is in the deal for shareholders of both companies.
MAG Silver Corp.’s (MAG:TSX; MAG:NYSE American) stock rose more than 7% on Monday after it announced it has entered into a definitive agreement to be acquired by Pan American Silver Corp. (PAAS:TSX; PAAS:NASDAQ) for US$2.1 billion.
The company had just announced its second dividend, now shareholders woke up to a deal representing US$20.54 per MAG share, based on the closing price of Pan American’s common shares on the NYSE on Friday. The deal is made up of a mix of cash totaling US$500 million and 0.755 Pan American shares per MAG share.
MAG said it represents an about 21% and 27% premium, respectively, on a prorated basis to the closing price and the 20-day volume weighted average price of MAG’s common shares on the NYSE American.
After the transaction, MAG said its existing shareholders will own about 14% of Pan American shares on a fully diluted basis.
“This transaction represents a compelling opportunity for our shareholders, providing an immediate premium and meaningful exposure to Pan American’s world-class assets and proven growth strategy,” said MAG President and Chief Executive Officer George Paspalas. “We are proud of what we’ve accomplished at MAG, particularly our partnership with Fresnillo which has created extraordinary value at the exceptional Juanicipio mine. Through the acquisition of our interest by Pan American — a respected leader in the global precious metals industry — our shareholders will participate in an exciting future defined by operational excellence, substantial exploration potential, and strong financial stewardship with significant portfolio exposure.”
Pan American President and CEO Michael Steinmann said the acquisition brings “one of the best silver mines in the world” into Pan American’s portfolio. Juanicipio is a joint venture between MAG and Fresnillo Plc, with MAG owning 44%.
“Juanicipio is a large-scale, high-grade, low-cost silver mine that will meaningfully increase Pan American’s exposure to high-margin silver ounces,” Steinmann said. “Furthermore, we see future growth opportunities through the significant exploration potential at Juanicipio as well as MAG’s Deer Trail and Larder properties. This strategic acquisition further solidifies Pan American as a leading Americas-focused silver producer.”
Steinmann said the companies together bring “many decades of operator experience in Mexico and Latin America to the Joint Venture, and we are looking forward to a collaborative future and value generation for all shareholders involved.”
Analyst Joe Reagor of Roth Capital Markets wrote an updated research note on the company Monday, maintaining his Neutral rating on MAG’s stock but raising the firm’s price target from US$16 to US$18 per share.
“We believe the transaction is likely to receive all necessary approvals and close later this year,” Reagor wrote.
‘The Scarcity Value of Silver Assets’
According to a report in Investing.com on Monday, Pan American saw its own shares decline by more than 6% on news of the transaction.
“The deal highlights the scarcity value of silver assets,” Royal Bank of Canada commented on the broader implications of the deal for the silver industry, according to the report. “Following last year’s combinations of Gatos/FirstMajestic and Silvercrest/Coeur, there are not many single asset producers left in the silver space. We see this as having a positive read through for Adriatic (ADT1 LN) and its Vares silver project.”
Also on Monday, Finimize wrote that the mixed market response “reflects investor enthusiasm for immediate gains while balancing concerns over strategic debt.”
Chen Lin of What Is Chen Buying? What Is Chen Selling? noted he had been trading MAG shares back and forth “with great success in the past years.”
“This move could enrich Pan American’s portfolio amid favorable silver demand, promising long-term growth, the site said. “This acquisition points to ongoing consolidation trends in mining, with firms combining forces to enhance exploration. As inflation hedging remains pivotal and renewable technologies grow, silver’s importance underlies strategic mergers and acquisitions like this one.”
In a conference call with Steinmann and Paspalas after the announcement on Monday, Paspalas said, “The transaction preserves everything we value at MAG: strong assets, a strong team, disciplined growth, responsible stewardship, and it faces and places it within a platform that can scale and grow further in a way that would be difficult to do when achieved independently.”
Paspalas said the company was proud of what it had accomplished at Juanicipio.
“We believe this is the right transaction at the right time, and we’re excited about the opportunity it represents for our shareholders and team,” he said.
Steinmann said the transaction “checks all the boxes of what we were looking for: a large-scale silver mine at the low end of the cost curve with a long reserve life and future exploration upside located within our geographic focus of the Americas.”
“Simply stated, Juanicipio is one of the largest-scale and lowest-cost primary silver mines in the world, and a 44% joint venture ownership interest with Fresnillo fits well in Pan American’s portfolio,” he continued.
Not Many Silver Mines Available for Purchase
Global Analyst Adrian Day said Pan American “needs/wants silver ounces; a majority of its revenues are from gold . . . (and) there not that many silver mines available for purchase.”
“This is a decent (but not great) deal for PAAS,” Day said. “I think it is an indication that the majors are looking for more ounces, in production or at least near term, and will pay up for them. It is also a positive for the Mexican mining sector, which has been a bit of a pariah in recent years.”
Global Analyst Adrian Day said Pan American “needs/wants silver ounces; a majority of its revenues are from gold . . . (and) there not that many silver mines available for purchase.”
Chen Lin of What Is Chen Buying? What Is Chen Selling? noted he had been trading MAG shares back and forth “with great success in the past years.”
He said he was surprised and thought Fresnillo would be the most likely major to purchase MAG.
“Maybe there’s a remote chance FRES would join the party?” Chen asked. “I do believe the M&A will continue. I am very focused on newly built high-margin mines.”
Reagor with Roth noted that he believed there was still a chance for Fresnillo to make an offer, as well.
“While we believe the transaction is likely to close, we note there remains potential for Fresnillo to make a competing bid,” Reagor wrote. “At this time, FRES has not agreed to a standstill but has also been supportive verbally and by allowing PAAS to conduct a site visit. We believe there remains potential for FRES to make a higher offer if they choose to do so.”
Two Dividends, Strong Cashflow
Earlier this month, MAG announced its second dividend for shareholders, a fixed dividend of US0.02 per share and an additional cashflow-linked dividend of US$0.18 per share for total of US$0.20 per share payable on May 28.
The company announced its inaugural dividend totaling of US$0.18 per share earlier this year and its first quarter financial results and production totals from Juanicipio.
The company reported a record net income of US$28.7 million (or US$0.28 per share) and adjusted EBITDA of US$55.8 million, driven by income from Juanicipio (equity accounted) of US$33.9 million and MAG’s attributable interest in Juanicipio adjusted EBITDA of US$59.5 million.
During April 2025, Juanicipio returned a total of US$61.5 to MAG: US$59.4 million as its second dividend, and US$2.1 million in interest and loan principal repayments. All loan balances to Juanicipio have now been fully repaid, MAG said.
The inaugural dividend payment was made to shareholders on April 21 before the company decided on the second one payable on May 28.
A total of 337,017 tonnes of ore at a silver head grade of 430 grams per tonne (g/t) (equivalent silver head grade of 660 g/t) was processed at Juanicipio during the quarter. Record silver recovery of 96%, up from 89% in Q1 2024, was also reported, reflecting the commencement of commercial pyrite and gravimetric concentrate production during Q2 2024 as well as the benefit from ongoing optimizations in the processing plant.
MAG said Juanicipio achieved silver production and equivalent silver production of 4.5 and 6.5 million ounces (Moz), respectively.
Juanicipio generated strong operating cashflow and free cashflow of US$86.4 million and US$77.4 million, respectively. It also continued to maintain its strong cost performance with an all-in sustaining cost of US$2.04 per silver ounce sold (US$10.64 per equivalent silver ounce sold).
The Catalyst: Volatile Market Still to See Increased Demand
According to Christopher Lewis writing for FX Empire on Friday, the silver market continues to see “a lot of back and forth.”
“Silver is highly susceptible to pressures from external sources, and as a result, (it tends) to be very volatile,” Lewis wrote.
“At this point in time, I just don’t see any momentum one way or the other,” Lewis said. “So, I think we will stay in this US$2 range for the time being and rangebound traders will love this market. Traders who go back and forth on short-term charts have been cleaning up in the silver market. And I think that more likely than not will remain the same until we get some type of movement on tariffs or negotiations.”
Lewis suggested caution as “volatility is most certainly a major problem with markets at the moment, and silver is almost always one of the more volatile ones.”
But the material’s industrial utility means there will still be a deficit for silver, which is the best conductor of electricity among the metals. [OWNERSHIP_CHART-536]
“Underpinning silver’s fundamentals is robust demand from industrial applications,” The Silver Institute said in its World Silver Survey 2024 report. “These continued to push higher last year, reaching a new all-time record, fueled by the remarkable rise in solar demand and in spite of stagnation in some other sectors. Sluggish silver supply, owing to the slight decline in global mine production, was another factor contributing to silver’s deficit conditions last year.”
Mordor Intelligence noted that silver is expected to register a compound annual growth rate (CAGR) of more than 5% between 2024 and 2029.
Ownership and Share Structure
Institutions own 70% of MAG, and 30% is retail, according to the company.
Top institutional shareholders include Juanicipio operator Fresnillo Plc. with 9%, BlackRock Investment Management (UK) Ltd. with 10.8%, Van Eck Associates Corp. with 9%, First Eagle Investment Management LLC with 6.2%, and Sprott Asset Management LP with 3%, the company said.
MAG Silver has a market cap of US$1.75 billion. It has 103.36 million shares outstanding, according to Reuters. It trades in a 52-week range of US$11.29 and US$18.27.
Sign up for our FREE newsletter at: www.streetwisereports.com/get-news
Important Disclosures:
- MAG Silver Corp. is a billboard sponsor of Streetwise Reports and pays SWR a monthly sponsorship fee between US$4,000 and US$5,000.
- As of the date of this article, officers and/or employees of Streetwise Reports LLC (including members of their household) own securities of Pan American Silver Corp.
- Steve Sobek wrote this article for Streetwise Reports LLC and provides services to Streetwise Reports as an employee.
- This article does not constitute investment advice and is not a solicitation for any investment. Streetwise Reports does not render general or specific investment advice and the information on Streetwise Reports should not be considered a recommendation to buy or sell any security. Each reader is encouraged to consult with his or her personal financial adviser and perform their own comprehensive investment research. By opening this page, each reader accepts and agrees to Streetwise Reports’ terms of use and full legal disclaimer. Streetwise Reports does not endorse or recommend the business, products, services or securities of any company.
For additional disclosures, please click here.

( Companies Mentioned: MAG:TSX; MAG:NYSE American,
)
Categories
Chinese Food for Thought
Source: Michael Ballanger 05/12/2025
Michael Ballanger of GGM Advisory Inc. takes a look at the current state of the market in light of the back and forth between Trump and China. He also shares an update on one copper stock.
This week, the capital markets the world over started the week on pins and needles with the “Tariff Tantrums” (or fear thereof) keeping volumes muted and order flow on the defensive. Then, as if an executive order came down from the top, the Chinese sent an olive branch to the White House, a type of necessary nourishment for wounded sentiment, which was met with open arms and dovish headlines. And that, my friends, was all that Wall Street needed as the narrative shifted rapidly to one favoring the S&P 500 low around 4,910 caused by the “Liberation Day” hijinks as “THE” low for the correction.
All dips are to now be bought aggressively because “American exceptionalism” has returned with a vengeance, because the Department of Government Efficiency has solved the $36 trillion debt problem. The slowing economy is good for stocks and great for bonds, but even better for gold, which was coming off two weeks of downside probing as the equity markets recovered.
Call it “Chinese Food” for thought, consumption, or sentiment adjustment, but the fact that the Chinese have thrown a peace offering at the Trump administration is a testament to the severity of the damage to the U.S. bond market during the early April façade. To say that tariffs are “good” for America is about as inane a comment that could ever be levied, but what makes it even more absurd is that 100% tariffs levied on April 7 were great, but the revisions down to 10% tariffs this week are now perceived as “even greater.”
If it is the “uncertainty” that prompted Fed chairman Powell to stand pat, leaving rates unchanged on Wednesday, it is the fact that he repeated the word 500 times during his 45-minute press conference. Powell said that the ramifications of tariffs on the U.S. economy would be deemed as “inflationary,” but because no one at the Fed was “certain,” they would take a wait-and-see approach while running the risk of being behind the curve if and when the data finally confirms an economy sliding headlong into recession.
Since the Fed relies primarily on lagging data, by the time the real-time evidence confirms that recession has arrived, it is by then far too late for the Fed to spring to action with “Emergency Rate Cuts” and TARP and QE and all the other gimmickry dressed up as “Fed tools” all cleverly disguised to deceive the masses. The real threat to the U.S. has nothing to do with “unfair trade deals“; the threat lies squarely on the shoulders of the banco-politico elite that continue to create fictitious “wealth” through the creation of a magical credit line called the budget deficit that continues to grow with each passing day. The U.S. Congress and the White House manufacture the debt and then try to tax foreign nations through tariffs to make up for the shortfall between tax revenues and government expenditures.
When I founded the GGM Advisory five years ago, the title of the introductory issue was “New Decade, Old Deceptions” and then “. . . but DEBT is the money of slaves. (Norm Franz).” In the past five years, I have pointed consistently to the growing and unsustainable debt monster lurking beneath the surface of “American Exceptionalism.“
The mainstream media constantly highlight the standard of living and the innovation and the size of the GDP as proof positive of American superiority and while it is true that a great portion of technological advances have been born in the U.S.A., if every country on this planet was able to access an unsecured credit line whenever they chose to do so, they too could lay claim to “exceptionalism.”
Because the world refuses to deny America the right to its “reserve currency status,” lawmakers acting on advice and instruction from the banco-politico elite can create trillions of dollars with the wave of a pen and never be held accountable. No terms and conditions are ever in place; no time lines on the repayment of the debt; and no collateral need ever be used as security. A multi-trillion-dollar credit line, all based upon “the full faith and credit” of the American government, allows it to sustain the military-industrial complex that President Eisenhower warned of in his farewell speech. That insidious complex feeds on itself as the only thing that sustains the war machine, and the replacement of its tools is war itself. Take away the credit line afforded by the reserve currency status, and you take away the wars fought by the American war machine in Iraq, Afghanistan, and now Eastern Europe.
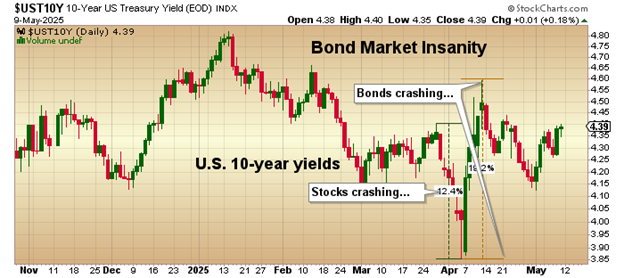
Fast forward to Q2 2025 and there is a stock market once again rushing blindly and obediently back to the highs of Q1 as the early-April “Tariff Tantrums” that sent stocks crashing have since been replaced by moderation and discretion enforced upon the White House not by sage counsel and wise introspection but rather by the violent objection of the bond market. Watching the 10-year yield swing from 4.30% to 3.85% and then back to 4.6% all within a one-week period was systemic instability of the first order.

As you can see, the bond market has calmed down in perfect correlation to White House threats and rhetoric regarding tariffs and the trade deficit. President Trump is finally listening to the scolding of his advisors, like Treasury Secretary Scott Bessent, and has toned down the vitriol, which includes his public whipping of Fed Chairman Powell. Trump did a complete “one-eighty” in a very short stint, going from “I am going to fire him” to “I never said I would fire him” all in a highly predictable response to a plummeting stock market and bond market turmoil.
After all of the trade deals are consummated winding up pretty much as they were before the tumult, the only threat that remains is not China or Canada or Mexico ripping off the “average American worker“; it is the debt monster that continually eats away at the purchasing power of his/her savings through serial debasement brought about through debt monetization. The last time the U.S. floated a balanced budget was in the fiscal year ended September 30, 2001.
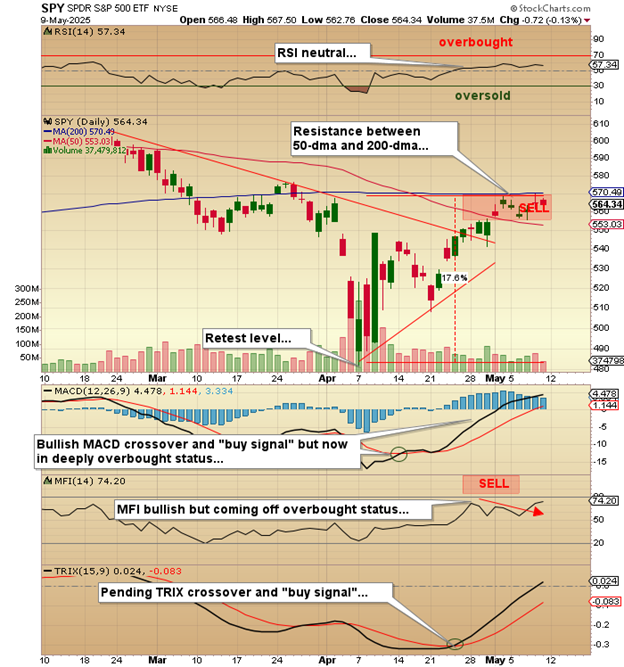
That was over 30 years ago. I know of no business or household that can survive running a deficit for twenty-three consecutive years. And yet, the S&P continues to recover with retail buyers back in the hunt just as they have been during every correction since 2008, when Hank Paulson begged Congress for a bailout and then let the banks and brokers pay out record bonuses with taxpayer cash. The New Generation of traders has all been brainwashed into an unwavering belief that no matter what goes down, stocks will be saved at all costs. Not the dotcom crash or 9/11 or the immolation of the mortgage holders in 2008 or the insolvent risk-impaired banks in 2023 could derail the march to 40,000 on the Dow and 6,000 for the S&P, all while debt continues to grow with the U.S. economy showing signs of fragility.
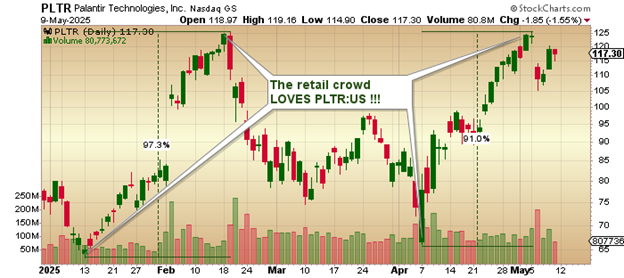
As I have written before in recent missives, this rally is a B-wave rally that is doomed to failure. It has been shepherded largely by the retail crowd that has been all over stocks like Palantir that have rewarded “AI” lovers with a near-double in January and again since the “Liberation Day” lows. In my experience, which goes back to the 1970s in practice and the 1900s in knowledge, true stock market bottoms do not materialize with the retail public repeating past behaviors (and getting rewarded). True stock market bottoms are born out of revulsion and disbelief. In the period of 1966-1982, markets absolutely punished investors to the point where, by the August 1982 bottom, less than 4% of households owned any common stocks.
Here in 2025, after decades of perennial stock market rescues, over 58% of all U.S. households own common stocks. In the end, you can’t really blame the Millennials and Gen-Xers for behaving the way they do, blindly inhaling every stock deemed “cool” by their social media judges and juries. You can’t blame them any more than the Pavlovian canine that salivates every time it hears a bell chime. When stocks dip, you buy. Unfortunately, my age and level of cynicism prevent me from carrying the banner of unbridled love for equities.
I remain a cautious bear.
Gold / Silver / Copper
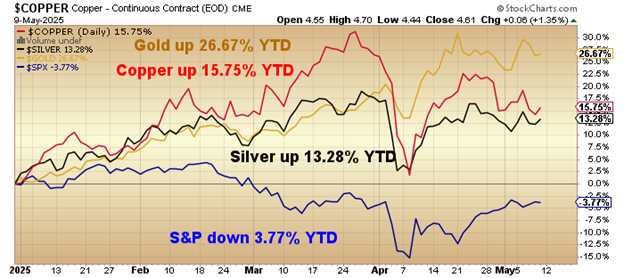
When the year began, I replaced copper with gold as the premier asset to own in 2025. My fears over tariffs and reduced fiscal stimulus rendered me incorrect in my reasoning, but bang-on in my execution. Gold has had a monster move led by central bank hoarding up 26.67% YTD, with copper up 15.75% and silver up 13.28%.
The S&P 500, which is down 3.77% YTD, was offside over 13.8 % at the close of “Liberation Day” trading back on April 7 and is having the worst start for any trading year since the Covid crash of Q1 2020. Mind you, it was massive debt creation through fiscal and monetary stimulus that rescued stocks in classic Pavlovian fashion back then, but thus far in 2025, we are seeing little in the form of emergency lifelines thrown to the Wall Street dog paddlers.
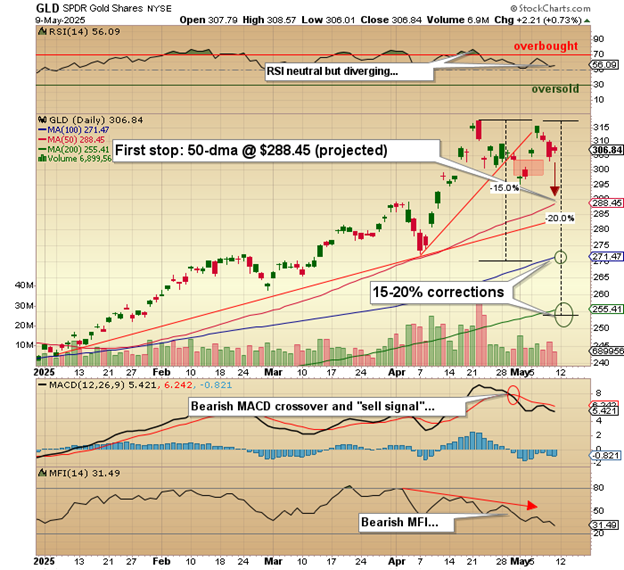
June gold futures peaked on April 22 at $3,509.90, with the GLD:US peaking at $317.63, with relative strength readings for both in the high 70s, which constituted overbought conditions that did not necessarily indicate a top was in, but certainly hinted at a pause. I put on a hedge shortly after the peak and have been trading that position back and forth, covering on sharp down days and re-establishing it in sharp rallies. As I have written before, in majestic bull markets such as the kind that gold is currently enjoying, one should be either flat, long, or leveraged long. The only reason to be short in a bull like this one is to protect other positions vulnerable to a gold drawdown.
If the current consolidation runs its usual course, there should be a 15-20% correction off the April highs that will serve to work off the overbought condition (which still appears on the weekly and monthly charts).
That correction should align with the seasonality chart shown below where the weakest month of the year for gold is June.
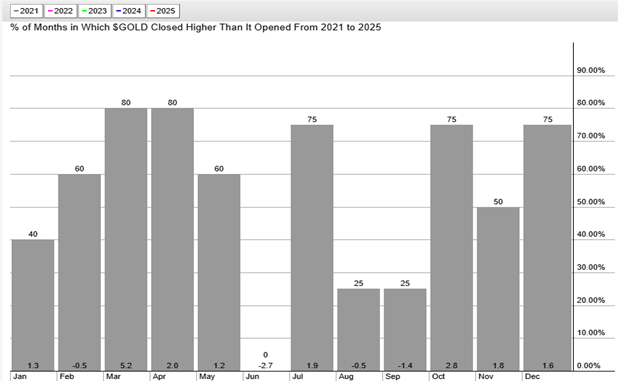
If my calculations are correct, then my proxy for gold (GLD:US) should find its footing in the $254-$270 range, which for June Gold would be in the $2,807-$2,983 range.
Make no mistake; I am a gold bull and have been since the first issue of the GGM Advisory was emailed out in January of 2020. However, I am not a gold zealot. I have no issue whatsoever selling gold or silver if the technical picture demands it. There are thousands of body bags lying at the side of the precious metals highway, containing the remains of those who viewed a sale of either metal as sacrilege. It is what keeps the bullion banks enriched as they rub their hands together every time one of Rick Rule’s followers enters the fray.
The billion bank cretins are merciless in their treatment of those underfunded players in the precious metals pits. They are absolute masters in setting up false break-outs and false break-downs purposely designed to entrap, torture, and disembowel the unsuspecting speculator that just finished watching a podcast with retired investment bankers posing as gold “gurus” drone on for what seems like days about “government debasement” and “the need for sound money” and “my favorite strategy for making money.” These precious metals “influencers” are usually gifted orators with wonderful commands of the English language, using seductive body language and subtle nuance to lure the newbies with a few thousand dollars into the crosshairs.
From conversations with the younger members of the investment community, it would appear that the “kiddies” (as I like to call them) have voted to use Bitcoin as their store of value as protection against the currency debasement, leaving gold as the metal of choice for their aging (and obviously out-of-touch) grandparents. Not so for silver, though, no-sir-ee, because it remains both a monetary metal and an industrial metal whose use in solar panels and the Electrification Movement place it squarely in the category of being “socially conscious” and therefore an exclusive domain of the younger generation.
This is the precise reason why this elderly grandparent has elected to begin building a position in silver by way of a number of junior explorers/developers with projects that include primary silver deposits. You see, it matters not what we Baby Boomers think is justified as a “store of value” because my generation is rapidly becoming yesterday’s news. It is a generation in decline by way of aging or retirement or other more punctuative outcomes, which means the bids for gold are going to be growing fewer and farther between as the years roll on. By contrast, the world population is expanding, and these new entrants to the investment community have decided that silver is a far better place to have their savings than gold, where the evil bullion banks (populated largely by corrupt Baby Boomer traders) have been punishing investors for decades.
The way I see it, the kiddies are coming in waves for silver. Silver futures, silver bars and wafers, silver coins and silver forks and spoons, but by far the biggest impact will be felt when they descend upon the scant few primary silver equities out there that can be counted on all fingers and toes, but not a lot more. Scarcity will certainly be a factor when they decide that there are just too many cryptocurrencies and “AI” companies from which to choose and elect instead to buy all of the listed silver deals at any price.
(As an aside, there is one such company that I am including in my silver basket that shall remain the exclusive property of my subscribers. Drop me an email and I will provide details.)
Copper looks like it is struggling to maintain its uptrend after a blistering move in March to a record high of $5.346/lb. After which it got totally smoked down to $4.03 after the White House threatened to impose a 100% tariff on the biggest copper consumer on the planet — China.
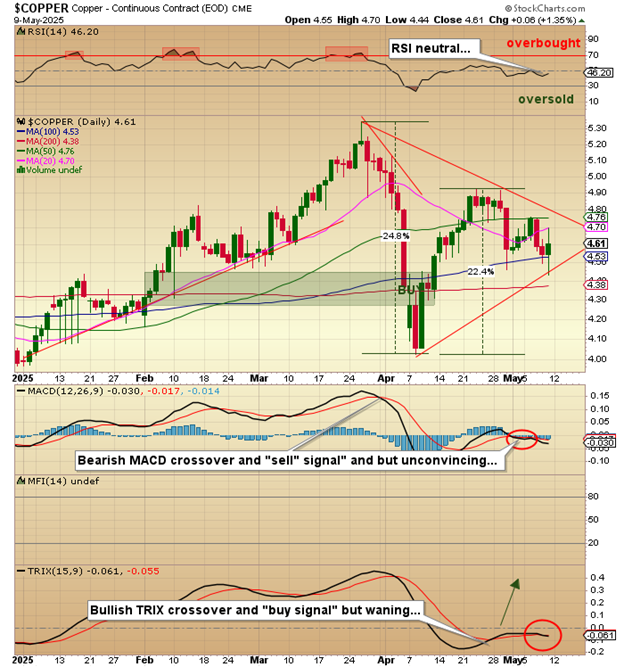
They responded in a manner very “Chinese” in manner as inventories on the Shanghai Exchange dropped to record low levels. Copper-consuming companies are hoarding any and all existing copper supply for fear that U.S. actions may interrupt the flow of the red metal into their domain.
We know for sure that Chinese exports contain a lot of copper, either in electronics or in household products such as stoves and refrigerators. Followers of this publication have heard the bullish narrative all too many times, but from where I sit, there is no plausible argument against copper that can survive when one considers both the dwindling state of supply and the soaring state of demand.
I have read volume after volume of essays, white papers, and industry reports on why copper is moving into surplus in 2026, with the authors all using the “China slowdown” narrative as the principal reason for their copper-bearish outlook. The problem is that none of these reports considers that the demand driver for Chinese copper does not emanate from exports. It is emanating from the desire for an upgrade to their electrical grid. The uranium gurus out there in the Twitterverse and the blogosphere all point to the fifty-odd modular nuclear reactors under construction in the Red Dragon as a bullish driver for uranium but I choose to counter that by asking them how they plan to transmit all of that new electrical current through a grid that hasn’t been upgraded in over fifty years.
It is domestic demand for copper that is going to drive copper pricing from now until the end of the decade, at which point prices will need to exceed US$15,000/metric tonne in order to rationalize the CAPEX required to build a copper mine. New discoveries are going to be fiercely impactful upon valuations for the junior explorer fortunate enough to make such discoveries. Demand for new supply is always met by exploration success by the junior explorers. We have seen it since the pandemic in lithium, nickel, and uranium, and are about to experience it in copper.
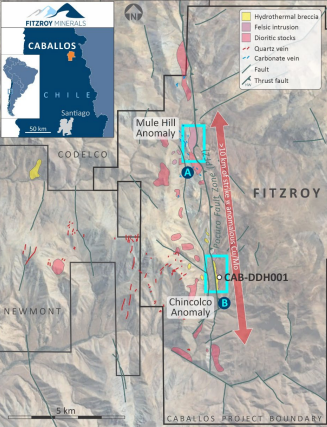
Speaking of copper discoveries, GGMA favorite Fitzroy Minerals Inc. (FTZ:TSX.V; FTZFF:OTCQB) released a drilling update last week, which includes two crackerjack copper projects (Caballos and Buen Retiro) and one gold-silver-copper (Polimet).
They also released a video via “X” (Twitter) whereby COO Gilberto Schubert describes the context of the molybdenum content in drill hole DDH001, which was the initial discovery hole announced on March 27, just before the “Liberation Day” nonsense torpedoed the junior mining markets.
Schubert explains that copper-molybdenum deposits in Chile usually average 200-400 ppm (0.02-0.04%) “moly” in the larger deposits, with extremely high-grade moly occurring only in narrow veins or dikes. In this initial discovery hole, there was a 42-meter section that ran 1,700 (0.17%) molybdenum making the moly content a “co-product” along with the copper rather a “credit” in that section of the intercept which, I should add, was 200 meters of 0.83% Cu-Eq mineralization starting from a depth of 66 meters (shallow).
The moly content is “off the scale. . .”
Drilling should be underway with another 2,700 meters (approximately nine holes) in their Phase Two program, which I believe carries the potential to launch FTZ/FTZFF into the big leagues if they can repeat the success encountered in the initial discovery hole.
The “Chincolco anomaly,” the site of the initial discovery, has a twin brother located ten kilometers north of it called “Mule Hill,” so it will be interesting to see if this next round of drilling confirms that the mineralized corridor moves in the direction of the “la Mula.“
At a US$60m market cap, the Caballos discovery provides the company with the potential to quickly develop into a billion-dollar enterprise, which includes none of the other assets, especially Buen Retiro, which stands tall and proud on its own.
Assays pending from Buen Retiro and Polimet shortly.
Sign up for our FREE newsletter at: www.streetwisereports.com/get-news
Important Disclosures:
- As of the date of this article, officers and/or employees of Streetwise Reports LLC (including members of their household) own securities of Fitzroy Minerals Inc.
- : Michael Ballanger: I, or members of my immediate household or family, own securities of: Fitzroy Minerals Inc. My company has a financial relationship with: Fitzroy Minerals Inc. I determined which companies would be included in this article based on my research and understanding of the sector.
- Statements and opinions expressed are the opinions of the author and not of Streetwise Reports, Street Smart, or their officers. The author is wholly responsible for the accuracy of the statements. Streetwise Reports was not paid by the author to publish or syndicate this article. Streetwise Reports requires contributing authors to disclose any shareholdings in, or economic relationships with, companies that they write about. Any disclosures from the author can be found below. Streetwise Reports relies upon the authors to accurately provide this information and Streetwise Reports has no means of verifying its accuracy.
- This article does not constitute investment advice and is not a solicitation for any investment. Streetwise Reports does not render general or specific investment advice and the information on Streetwise Reports should not be considered a recommendation to buy or sell any security. Each reader is encouraged to consult with his or her personal financial adviser and perform their own comprehensive investment research. By opening this page, each reader accepts and agrees to Streetwise Reports’ terms of use and full legal disclaimer. Streetwise Reports does not endorse or recommend the business, products, services or securities of any company.
For additional disclosures, please click here.
Michael Ballanger Disclosures
This letter makes no guarantee or warranty on the accuracy or completeness of the data provided. Nothing contained herein is intended or shall be deemed to be investment advice, implied or otherwise. This letter represents my views and replicates trades that I am making but nothing more than that. Always consult your registered advisor to assist you with your investments. I accept no liability for any loss arising from the use of the data contained on this letter. Options and junior mining stocks contain a high level of risk that may result in the loss of part or all invested capital and therefore are suitable for experienced and professional investors and traders only. One should be familiar with the risks involved in junior mining and options trading and we recommend consulting a financial adviser if you feel you do not understand the risks involve

( Companies Mentioned: FTZ:TSX.V; FTZFF:OTCQB,
)
Source: Don DeMarco 05/12/2025
MAG Silver Corp. (MAG:TSX; MAG:NYSE American) posts a strong first quarter, declares a second dividend and announces continued exploration work at its three projects, noted a National Bank of Canada report.
MAG Silver Corp.’s (MAG:TSX; MAG:NYSE American) Q1/25 financials “topped the Street” and reflected “standout cost performance,” reported Don DeMarco, National Bank of Canada analyst, in a May 8 research note.
49% Uplift, Outperform Rating
National Bank of Canada maintained its CA$32.75 per share target price on MAG Silver, trading at the time of the report at about CA$21.98 per share. The target implies a potential return for investors of 49%.
The mining firm remains rated Outperform.
“Our thesis considers production growth at Juanicipio (44%), diversified metal production, a rerate to producer multiples, exploration upside, and mergers and acquisitions appeal tempered by Juanicipio joint venture (JV) terms, which limit profit sharing to once per year,” DeMarco wrote. Juanicipio is MAG’s JV project in Mexico.
Cash Flow and Balance
The analyst presented the highlights of MAG’s Q1/25 financial results. As for earnings per share, adjusted, it came in at US$0.28, ahead of consensus’ US$0.25 estimate but below National Bank’s US$0.30 projection.
MAG’s cash flow per share was (US$0.02) slightly better than National Bank’s (US$0.03) forecast.
The silver producer’s Q1/25 cash flow and cash balance were down quarter over quarter (QOQ). The company had US$156.5 million (US$156.5M) in cash and cash equivalents as of March 30, 2025, a drop from US$162.3M in Q4/24. Free cash flow during Q1/25 totaled (US$6.7M), significantly lower than US$48.8M in the previous quarter.
As for the Juanicipio JV, in Q1/25, its cash balance was up but its free cash flow was down QOQ. At quarter’s end, the JV had US$130.6M in cash and cash equivalents, up from US$53.2M in Q4/24. Its free cash flow was US$77.4M, lower than US$78.9M in Q4/24.
Lower Operational Costs
MAG’s Q1/25 performance was driven by cost tailwinds, DeMarco highlighted. This quarter, costs, on a per ounce of silver basis and net of byproducts, were lower than in Q4/24 and were below National Bank’s estimates.
Specifically, the total cash cost in Q1/25 was US$8.50 per ounce of silver equivalent (US$8.50/oz Ag eq), lower than US$8.80 in Q4/24 and lower than National Bank’s US$12.82 estimate.
Similarly, the all-in sustaining cost was down QOQ and below National Bank’s forecast. AISC was US$10.64/oz Ag eq. These figures compare to National Bank’s US$18.07 and Q4/24’s US$15.
In other developments during Q1/25, DeMarco reported, MAG declared a US$0.20 dividend, payable on May 28. Its previous and inaugural dividend was US$0.18.
“[The] dividend represents an annualized yield of about 5.2%, among top yields for silver names, from a long-life asset with exploration upside in Juanicipio,” wrote DeMarco.
Recent and Planned Drilling
Drilling was done at Juanicipio and Deer Trail in Q1/25, reported DeMarco. At Juanicipio, 6,992 meters (6,992m) were drilled in areas to be mined soon, such as the Valdecañas, Anticipada, Ramal 1, Ramal 2 and Venadas veins. Drill results remain pending. At Deer Trail in Utah, reverse circulation drilling was carried out of six pilot holes over 1,783m.
Exploration plans for MAG’s three projects this year include passive ambient noise tomography three-dimensional seismic, airborne radiometric and magnetic surveys to hone drill targeting at Deer Trail, about 25 kilometers of drilling of the Instant Pond zone at Larder in Ontario beginning this quarter and regional surface drilling at Juanicipio, also starting in Q2/25.
Sign up for our FREE newsletter at: www.streetwisereports.com/get-news
Important Disclosures:
- MAG Silver Corp. is a billboard sponsor of Streetwise Reports and pays SWR a monthly sponsorship fee between US$4,000 and US$5,000.
- This article does not constitute investment advice and is not a solicitation for any investment. Streetwise Reports does not render general or specific investment advice and the information on Streetwise Reports should not be considered a recommendation to buy or sell any security. Each reader is encouraged to consult with his or her personal financial adviser and perform their own comprehensive investment research. By opening this page, each reader accepts and agrees to Streetwise Reports’ terms of use and full legal disclaimer. Streetwise Reports does not endorse or recommend the business, products, services or securities of any company.
For additional disclosures, please click here.
Disclosures for National Bank of Canada, MAG Silver Corp., May 8, 2025
RISKS: Non-Operator: MAG’s primary asset is the Juanicipio property (44%) being developed in partnership with Fresnillo Plc (56%). As a non-operator, MAG does not directly control the future production or development of the asset and any delays in the forecasted production schedule could negatively impact revenue and indirectly impact the valuation of the company. Financing & Liquidity Risk: MAG is responsible for its share of development capex for Juanicipio. Post-development of the Juanicipio property, MAG will be exposed to risks related to fluctuating silver, gold, zinc, lead and fuel/power prices. ADDITIONAL COMPANY RELATED DISCLOSURES MAG Silver Corp. Aya Gold & Silver Inc. 360 First Majestic Silver Corp. Pan American Silver Corp. 2, 3, 5, 7 LEGEND FOR COMPANY RELATED DISCLOSURES: 2 National Bank Financial Inc. has acted as an underwriter with respect to this issuer within the past 12 months. 3 National Bank Financial Inc. has provided investment banking services for this issuer within the past 12 months. 4 National Bank Financial Inc. or an affiliate has managed or co-managed a public offering of securities with respect to this issuer within the past 12 months. 5 National Bank Financial Inc. or an affiliate has received compensation for investment banking services from this issuer within the past 12 months. 6 National Bank Financial Inc. or an affiliate has a non-investment banking services related relationship during the past 12 months. 7 The issuer is a client, or was a client, of National Bank Financial Inc. or an affiliate within the past 12 months. 8 National Bank Financial Inc. or its affiliates expects to receive or intends to seek compensation for investment banking services from this issuer in the next 3 months. 9 As of the end of the month immediately preceding the date of publication of this research report (or the end of the second most recent month if the publication date is less than 10 calendar days after the end of the most recent month), National Bank Financial Inc. or an affiliate beneficially own 1% or more of any class of common equity securities of this issuer. 10 National Bank Financial Inc. makes a market in the securities of this issuer, at the time of this report publication. 11 A partner, director, officer or research analyst involved in the preparation of this report has, during the preceding 12 months provided services to this issuer for remuneration other than normal course investment advisory or trade execution services. 12 A research analyst, associate or any other person (or a member of their household) directly involved in preparing this report has a financial interest in the securities of this issuer. 13 A partner, director, officer, employee or agent of National Bank Financial Inc., is an officer, director, employee of, or serves in any advisory capacity to the issuer. 14 A member of the Board of Directors of National Bank Financial Inc. is also a member of the Board of Directors or is an officer of this issuer. 15 A redacted draft version of this report has been shown to the issuer for fact checking purposes and changes may have been made to the report before publication. 360 An NBF analyst attended a tour of Aya’s Zgounder mine near Agadir, Morocco from April 15-16, 2025. A portion of the analyst’s expenses were paid by the issuer
DISCLOSURES GENERAL: This Report was prepared by National Bank Financial Inc. (NBF), a Canadian investment dealer, a dealer member of the Canadian Investment Regulatory Organization (CIRO) and an indirect wholly owned subsidiary of National Bank of Canada. National Bank of Canada is a public company listed on the Toronto Stock Exchange. The particulars contained herein were obtained from sources which we believe to be reliable but are not guaranteed by us and may be incomplete and may be subject to change without notice. The information is current as of the date of this document. Neither the author nor NBF assumes any obligation to update the information or advise on further developments relating to the topics or securities discussed. The opinions expressed are not to be construed as a solicitation or offer to buy or sell the securities mentioned herein, and nothing in this report constitutes a representation that any investment strategy or recommendation contained herein is suitable or appropriate to a recipient’s individual circumstances. In all cases, investors should conduct their own investigation and analysis of such information before taking or omitting to take any action in relation to securities or markets that are analyzed in this report. The report alone is not intended to form the basis for an investment decision, or to replace any due diligence or analytical work required by you or your advisers, if needed, in making an investment decision. The value of investments, and the income derived from them, can go down as well as up and you may not get back the amount invested. Neither past performance nor forecasts are a reliable guide to future performance. If an investment is denominated in a foreign currency, rates of exchange may have an adverse effect on the value of the investment. Investments which are illiquid may be difficult to sell or realize; it may also be difficult to obtain reliable information about their value or the extent of the risks to which they are exposed. Certain transactions, including those involving futures, swaps, and other derivatives, give rise to substantial risk and are not suitable for all investors. NBF makes no representation as to the proper characterization of the investments for legal, regulatory or tax purposes, or as to the ability of a particular investor to invest or transact in the investments under applicable legal restrictions. Differences in the legal and regulatory regimes in different jurisdictions may significantly impact the legal and regulatory risks affecting the investment sector and / or investment. It is your responsibility to assess any such differences and associated risks. This report is for distribution only under such circumstances as may be permitted by applicable law. This report is not directed at you if NBF or any affiliate distributing this report is prohibited or restricted by any legislation or regulation in any jurisdiction from making it available to you. National Bank of Canada Financial Markets is a trade name used by National Bank Financial Inc. and National Bank of Canada Financial Inc. CANADIAN RESIDENTS: NBF or its affiliates may engage in any trading strategies described herein for their own account or on a discretionary basis on behalf of certain clients and, as market conditions change, may amend or change investment strategy including full and complete divestment. The trading interests of NBF and its affiliates may also be contrary to any opinions expressed in this report. NBF or its affiliates often act as financial advisor, agent, lender or underwriter or provides trading related services for certain issuers mentioned herein and may receive remuneration for its services. NBF is a member of the Canadian Investor Protection Fund. UK RESIDENTS: This report is a marketing document. This report has not been prepared in accordance with legal requirements designed to promote the independence of investment research and it is not subject to any prohibition on dealing ahead of the dissemination of investment research. The report is only for distribution to Eligible Counterparties and Professional Clients in the United Kingdom within the meaning of the rules of the Financial Conduct Authority (FCA). The investments contained in this report are not available to retail customers and this report is not for distribution to retail clients (within the meaning of the rules of the FCA). Persons who are retail clients should not act or rely upon the information in this report. As required by the FCA, we have a policy in place to identify and manage the conflicts of interest which may arise in the production of non-independent research as contained and distributed in this report. In respect of the distribution of this report to UK residents, NBF has approved the contents (including, where necessary, for the purposes of Section 21(1) of the Financial Services and Markets Act 2000). NBF is authorized and regulated by the Financial Conduct Authority with registration number FC009503 and has its registered office at 70 St. Mary Axe, London, EC3A 8BE. U.S. RESIDENTS: With respect to the distribution of this report in the United States of America (the U.S.), National Bank of Canada Financial Inc. (NBCFI) is registered with the Securities Exchange Commission (SEC) as a broker-dealer and is a member of the Financial Industry Regulatory Authority (FINRA) and the Securities Investor Protection Corporation (SIPC). NBCFI operates pursuant to a 15 a-6 Agreement with its Canadian affiliates, NBF and National Bank of Canada. NatWealth Management (USA) Inc. (NatWealth) is a SEC-registered investment adviser.
This report has been prepared in whole or in part by research analysts employed by non-U.S. affiliates of NBCFI that are not registered as broker-dealers or investment advisers in the U.S. These nonU.S. research analysts are not registered as associated persons of NBCFI and are not licensed or qualified as research analysts with FINRA or any other U.S. regulatory authority and, accordingly, may not be subject (among other things) to FINRA restrictions regarding communications by a research analyst with the subject company, public appearances by research analysts and trading securities held in a research analyst account. NBF is a Participating Affiliate of NatWealth, and as such each research analyst who provides services to that constitute acting as an investment adviser under U.S. law and regulation is deemed an associated person of NatWealth as part of the participating affiliate regime established by SEC Staff no-action letters. If you make “hard dollar” payments in respect of NBF research services, then such services, including this report, are provided to you by NatWealth under the U.S. Investment Advisers Act of 1940 (the Advisers Act). If you do not make “hard dollar” payments in respect of NBF research services, then such services, including this report, are provided to you via intermediation of NBCFI under Rule 15a-6, and are not subject to the Advisers Act. Because the views of research analysts may differ, members of NBF Group may have or may in the future issue reports that are inconsistent with this report, or that reach conclusions different from those in this report. To make further inquiry related to this report, U.S. residents should contact their NBCFI registered representative or NatWealth associated person, as applicable. HK RESIDENTS: With respect to the distribution of this report in Hong Kong by NBC Financial Markets Asia Limited (NBCFMA) which is licensed by the Securities and Futures Commission (SFC) to conduct Type 1 (dealing in securities) and Type 3 (leveraged foreign exchange trading) regulated activities, the contents of this report are solely for informational purposes. It has not been approved by, reviewed by, verified by or filed with any regulator in Hong Kong. Nothing herein is a recommendation, advice, offer or solicitation to buy or sell a product or service, nor an official confirmation of any transaction. None of the products issuers, NBCFMA or its affiliates or other persons or entities named herein are obliged to notify you of changes to any information and none of the foregoing assume any loss suffered by you in reliance of such information. The content of this report may contain information about investment products which are not authorized by SFC for offering to the public in Hong Kong and such information will only be available to those persons who are Professional Investors (as defined in the Securities and Futures Ordinance of Hong Kong (SFO)). If you are in any doubt as to your status you should consult a financial adviser or contact us. This material is not meant to be marketing materials and is not intended for public distribution. Please note that neither this material nor the product referred to is authorized for sale by SFC. Please refer to product prospectus for full details. There may be conflicts of interest relating to NBCFMA or its affiliates’ businesses. These activities and interests include potential multiple advisory, transactional and financial and other interests in securities and instruments that may be purchased or sold by NBCFMA or its affiliates, or in other investment vehicles which are managed by NBCFMA or its affiliates that may purchase or sell such securities and instruments. No other entity within the National Bank of Canada group, including National Bank of Canada and National Bank Financial Inc., is licensed or registered with the SFC. Accordingly, such entities and their employees are not permitted and do not intend to: (i) carry on a business in any regulated activity in Hong Kong; (ii) hold themselves out as carrying on a business in any regulated activity in Hong Kong; or (iii) actively market their services to the Hong Kong public. EU RESIDENTS: With respect to the distribution of this report in the member states of the European Union (EU) and the European Economic Area (EEA) by NBC Paris, the contents of this report are for information purposes only and do not constitute investment advice, investment research, financial analysis or other forms of general recommendation relating to transactions in financial instruments within the meaning of Directive 2014/65/EU of the European Parliament and of the Council of 15 May 2014 (MiFID 2). This report is intended only for professional investors and eligible counterparties within the meaning of MiFID 2 and its contents have not been reviewed or approved by any EU/EEA authority. NBC Paris is an investment firm authorized by the French Prudential Control and Resolution Authority (ACPR) to provide investment services in France and has passported its investment services throughout the EU/EEA under the freedom to provide services and has its registered office at 8 avenue Percier, 75008 Paris, France. “NBC Financial Markets, a subsidiary of National Bank of Canada” is a trade name used by NBC Paris S.A. NBF is not authorized to provide investment services in the EU/EEA COPYRIGHT: This Report may not be reproduced in whole or in part, or further distributed or published or referred to in any manner whatsoever, nor may the information, opinions or conclusions contained in it be referred to without in each case the prior express written consent of NBF. RESEARCH ANALYSTS: All of the views expressed in this research report accurately reflect the research analyst’s personal views regarding any and all of the subject securities or issuers. No part of the analyst’s compensation was, is, or will be, directly or indirectly, related to the specific recommendations or views expressed in this research report. The analyst responsible for the production of this report certifies that the views expressed herein reflect his or her accurate personal and technical judgment at the moment of publication. NBF compensates its research analysts from a variety of sources. The Research Department is a cost centre and is funded by the business activities of NBF including Institutional Equity Sales and Trading, Retail Sales, the correspondent clearing business, and Corporate and Investment Banking. Since the revenues from these businesses vary, the funds for research compensation vary. No one business line has a greater influence than any other for research analyst compensation. Ratings And What They Mean: PRIMARY STOCK RATING: NBF has a three-tiered rating system that is relative to the coverage universe of the particular analyst. Here is a brief description of each: Outperform (OP) – The stock is expected to outperform the analyst’s coverage universe over the next 12 months; Sector Perform (SP) – The stock is projected to perform in line with the sector over the next 12 months; Underperform (UP) – The stock is expected to underperform the sector over the next 12 months. SECONDARY STOCK RATING: Under Review (UR) − Our analyst has withdrawn the rating because of insufficient information and is awaiting more information and/or clarification; Tender (T) − Our analyst is recommending that investors tender to a specific offering for the company’s stock; Restricted (R) − Because of ongoing investment banking transactions or because of other circumstances, NBF policy and/or laws or regulations preclude our analyst from rating a company’s stock. INDUSTRY RATING: NBF has an Industry Weighting system that reflects the view of our Economics & Strategy Group, using its sector rotation strategy. The three-tiered system rates industries as Overweight, Market Weight and Underweight, depending on the sector’s projected performance against broader market averages over the next 12 months. RISK RATING: As of 7 | Page June 30, 2020, National Bank Financial discontinued its Below Average, Average and Above Average risk ratings. We continue to use the Speculative risk rating which reflects higher financial and/or operational risk. DISSEMINATION POLICY: Please click on this link to access NBF’s Research Dissemination Policy. COMPANY RELATED DISCLOSURES: Please click on this link to access Company Related Disclosures

( Companies Mentioned: MAG:TSX; MAG:NYSE American,
)
Source: Streetwise Reports 05/12/2025
West Red Lake Gold Mines Ltd. (WRLG:TSX.V; WRLGF:OTCQB; FRA:UJO) sold 2,350 ounces from its Ontario bulk sample for US$7.7 million, validating mine restart plans. Read more to find out how this positions the company for stronger economics.
West Red Lake Gold Mines Ltd. (WRLG:TSX.V; WRLGF:OTCQB; FRA:UJO) has announced proceeds of US$7.7 million from the sale of gold produced during its bulk sample program at the Madsen Mine in Ontario. According to the May 8 news release, the company sold 2,350 ounces of gold — out of a total 2,498 ounces produced — at a weighted average price of US$3,293 per ounce between late March and early May 2025. The remaining ounces will be sold upon final settlement with the refiner.
The bulk sample initiative forms part of West Red Lake’s strategy to validate its pre-feasibility mine plan and confirm expected grade and tonnage ahead of a planned production restart in the second half of 2025. The company acquired the Madsen Mine in 2023 and has since advanced a restart plan focused on implementing a more rigorous drilling program to improve resource confidence, upgrading underground development, and enhancing surface infrastructure to support efficient mine operations.
According to the company’s May 2025 investor presentation, the Madsen project has a projected after-tax net present value (NPV) of US$496 million based on a gold price of US$2,640 per ounce and a discount rate of 5%. The plan outlines annual gold production of 67,600 ounces over six years, with average diluted head grades of 8.2 grams per tonne and an expected gold recovery rate of 95.7% through an 800-tonne-per-day mill. The project’s initial capital requirement was estimated at US$44 million on January 7th, and the all-in sustaining cost (AISC) is forecasted at US$1,681 per ounce.
The company stated that it had CA$31 million in cash on hand as of February 26, 2025, and access to an additional US$20 million via a debt facility, both of which support its mine restart strategy. The mine’s historical performance and updated technical work, including tighter drill spacing of approximately 7 meters and enhanced underground access via a newly completed connection drift, aim to mitigate continuity and operational risks. The company also reported that the Madsen mill, which resumed processing after a 28-month dry shutdown, restarted smoothly.
Surge in Gold Prices Renews Focus on Junior Developers
Recent commentary across the industry has pointed to a shifting landscape for gold, with several analysts highlighting favorable conditions for both bullion and junior mining equities. On May 4, Ahead of the Herd noted that stagflation fears and broader macroeconomic uncertainty were fueling demand for gold as a defensive asset. The publication stated that “gold does well in stagflationary periods and outperforms equities during recessions,” referencing data showing that during past stagflationary cycles, gold returned an average of 32.2% compared to negative returns for equities.
On May 7, O’Keefe reiterated his Buy rating and raised his target price to CA$2.20.
On May 7, Stockhead reported that a record gold price, at over US$3,200 per ounce, was playing a major role in bringing new gold developers to the forefront, especially in the Australian market. The article emphasized that “normalizing conditions, waning inflation and a record high gold price… mean gold developers are flourishing once again.” It also highlighted that easing post-pandemic constraints had reignited several stalled expansion projects, with developers now advancing more aggressively.
In a May 9 report, Morris Hubbartt of Super Gold Signals commented that the gold equity sector had entered what he described as a “blastoff zone,” particularly for junior miners. He pointed to increased interest from investors as a sign that sentiment was shifting in favor of early-stage developers.
The positive momentum was further underscored in a May 12 editorial from Junior Stocks, which cited Canadian mining executive Rob McEwen’s bullish stance on the sector. McEwen projected that gold equities were on the verge of a dramatic re-rating, driven by growing institutional interest and increased central bank buying. He argued that even marginal projects could become viable at current bullion prices, and added that “this isn’t just a bull market for the metal — it’s the opening act of a much bigger show for gold equities.”
Analysts Highlight Progress and Revaluation Potential at West Red Lake Gold
In a March 19 research note, Cantor Fitzgerald analyst Matthew O’Keefe continued coverage with a Buy rating and a one-year target price that implied a 114% return. He pointed to construction progress at the site, including the 94% completion of the 1.4-kilometer connection drift, a ramp-up in underground development, and operational readiness supported by the company’s newly built 114-person camp facility.
On April 3, Jeff Clark of The Gold Advisor reiterated a Strong Buy recommendation, describing West Red Lake Gold as being on the “preproduction golden runway.” He highlighted the potential for the stock to benefit from both the rising gold price environment and the company’s move toward production.
Reporting on April 14, Paul O’Brien of Velocity Trade Capital issued an Outperform rating with a target price of CA$1.25, reinforcing positive sentiment around the company’s near-term milestones and potential for revaluation.
On May 7, O’Keefe reiterated his Buy rating and raised his target price to CA$2.20, citing ongoing execution and increased visibility at Madsen. That same day, Chen Lin of What is Chen Buying? What is Chen Selling? reviewed West Red Lake’s recently completed bulk sample, stating, “Gold grades are pretty consistent, right on the prediction. This is similar to PVG bulk sampling if you remember, and should be very positive and give a boost to confidence when the mining starts in a month or so.”
In a research repot from May 8, Red Cloud Securities analyst Taylor Combaluzier maintained a Buy rating and CA$2.50 target price, representing a 268% return from the share price at the time of the report. Combaluzier emphasized that the bulk sample results “give us confidence that the company is poised for success as it ramps up the mine in H2/25 and could potentially deliver better economics than outlined in the preliminary feasibility study (PFS).”
He detailed reconciliation metrics from the bulk sample, noting that actual tonnage reached 14,190 tons compared to a predicted 15,170 tons, equating to a 95.5% reconciliation. The average gold grade came in at 5.72 grams per tonne (g/t), slightly above the predicted 5.68 g/t. Total gold in mill feed reconciled at 96.1%, while recovery averaged 95%, in line with PFS projections.
Combaluzier concluded that the data supported the strength of the geological model, underpinned by 90,000 meters of definition drilling since October 2023. He also noted that the potential switch to long-hole stoping from mechanized cut-and-fill could reduce mining costs by over 50%, based on PFS estimates of CA$57.68 per tonne versus CA$136.49 per tonne, respectively.
Momentum and Milestones: What to Watch in 2025
The company’s ongoing activities suggest several key developments for 2025. According to the investor materials, ramp-up of mining and processing at Madsen is expected to gradually increase toward the nameplate rate of 800 tonnes per day in the second half of the year. With no principal debt repayments due until 2026, the near-term focus remains on scaling operations efficiently.
Additionally, exploration work is underway to extend resources beyond the current mine plan. Targets accessed via the new connection drift include extensions of the McVeigh, South Austin, and Austin zones, while future drilling is planned at the Fork and Rowan deposits. The Rowan deposit, which holds an indicated resource of 476,323 tonnes at 12.8 grams per tonne, is currently under consideration for bulk sampling between 2027 and 2028. [OWNERSHIP_CHART-5614]
The company is also exploring opportunities in under-tested geological zones across its broader property, including areas within the Confederation rocks — now viewed as highly prospective based on recent sampling and mapping. These programs aim to identify additional high-grade mineralization to support future production scenarios beyond the existing pre-feasibility study.
West Red Lake continues to emphasize operational readiness, noting that over 200 personnel have been hired and safety performance remains strong. Underground development and stockpile growth are on track, with a high-grade stockpile target of 30,000 tonnes providing over one month of mill flexibility. As the company transitions from test mining to full-scale operations, continued updates on gold reconciliation results and drilling progress are expected to be important indicators of forward momentum.
Ownership and Share Structure
Strategic investor Sprott Resource Lending Corp. holds about 8%. Institutions hold about 30%, management, insiders, and advisors hold about 10%, and the remaining shares are held by retail investors.
The company’s market cap is CA$259 million. The 52-week range for the stock is CA$0.52 to CA$1.04.
Sign up for our FREE newsletter at: www.streetwisereports.com/get-news
Important Disclosures:
- West Red Lake Gold Mines Ltd. is a billboard sponsor of Streetwise Reports and pays SWR a monthly sponsorship fee between US$4,000 and US$5,000.
- As of the date of this article, officers and/or employees of Streetwise Reports LLC (including members of their household) own securities of West Red Lake Gold Mines Ltd.
- James Guttman wrote this article for Streetwise Reports LLC and provides services to Streetwise Reports as an employee.
- This article does not constitute investment advice and is not a solicitation for any investment. Streetwise Reports does not render general or specific investment advice and the information on Streetwise Reports should not be considered a recommendation to buy or sell any security. Each reader is encouraged to consult with his or her personal financial adviser and perform their own comprehensive investment research. By opening this page, each reader accepts and agrees to Streetwise Reports’ terms of use and full legal disclaimer. Streetwise Reports does not endorse or recommend the business, products, services or securities of any company.
For additional disclosures, please click here.

( Companies Mentioned: WRLG:TSX.V; WRLGF:OTCQB; FRA:UJO,
)
Source: Matthew O’Keefe 05/12/2025
West Red Lake Gold Mines Ltd. (WRLG:TSX.V; WRLGF:OTCQB; FRA:UJO) moves closer to restarting Madsen now that the bulk sample program is done and returned positive results, noted a Cantor Fitzgerald report.
West Red Lake Gold Mines Ltd.’s (WRLG:TSX.V; WRLGF:OTCQB; FRA:UJO) bulk sample program at its Madsen gold project in Ontario’s Red Lake District yielded positive reconciliation results, reported Matthew O’Keefe, Cantor Fitzgerald analyst, in a May 7 research note.
“The positive test results derisk the project further and signal that West Red Lake Gold can move to start ramping up the mine with confidence, which the company has noted will happen in the coming months,” O’Keefe wrote.
219% Return Potential
On the news, Cantor maintained its Buy rating and CA$2.20 per share target price on the Canadian explorer, noted the analyst.
“We remain confident that the restart of the Madsen mine will be successful and that the high-grade nature of the mine, with its significant upside potential, should ultimately drive a premium valuation,” O’Keefe commented.
West Red Lake Gold’s share price at the time of the report was CA$0.69 per share. From this price, the return to target is 219%.
The company has 343.2 million (343.2M) basic shares outstanding and 517M fully diluted shares outstanding. Its market cap is CA$236.8 million. Its 52-week range is CA$0.52–0.88 per share.
About the Sample, Results
O’Keefe described the sample and the reconciliation results. The 14,490-ton bulk sample included material from three main resource zones at Madsen: Austin, South Austin and McVeigh. Material was extracted in accordance with the workflow and methodology to be used for day-to-day operations at Madsen.
The predicted and actual grades and tonnages were close. This speaks to how important definition drilling and tailed stope design are to accurate modeling of gold mineralization. West Red Lake Gold carried out 90,000 meters of definition drilling since October 2023.
The Madsen bulk sample produced 2,498 ounces of gold, during which the mill performed as expected, with gold recovery averaging 95%.
The average gold grade was shown to be 5.72 grams per ton (5.72 g/t), about 0.7% higher than the predicted average grade of 5.68 g/t for the target areas.
“Overall, these results are in line with expectations and, importantly, validate the company’s geological and resource model, mining method and mill performance,” O’Keefe wrote.
As for readiness to restart Madsen, the underground development continues, noted O’Keefe. The mill is staffed and ready.
Sign up for our FREE newsletter at: www.streetwisereports.com/get-news
Important Disclosures:
- West Red Lake Gold Mines Ltd. is a billboard sponsor of Streetwise Reports and pays SWR a monthly sponsorship fee between US$4,000 and US$5,000.
- As of the date of this article, officers and/or employees of Streetwise Reports LLC (including members of their household) own securities of West Red Lake Gold Mines Ltd.
- Doresa Banning wrote this article for Streetwise Reports LLC and provides services to Streetwise Reports as an independent contractor.
- This article does not constitute investment advice and is not a solicitation for any investment. Streetwise Reports does not render general or specific investment advice and the information on Streetwise Reports should not be considered a recommendation to buy or sell any security. Each reader is encouraged to consult with his or her personal financial adviser and perform their own comprehensive investment research. By opening this page, each reader accepts and agrees to Streetwise Reports’ terms of use and full legal disclaimer. Streetwise Reports does not endorse or recommend the business, products, services or securities of any company.
For additional disclosures, please click here.
Disclosures for Cantor Fitzgerald, West Red Lake Gold Mines Ltd., May 7, 2025
Disclaimers The opinions, estimates and projections contained in this report are those of Cantor Fitzgerald Canada Corporation. (“CFCC”) as of the date hereof and are subject to change without notice. Cantor makes every effort to ensure that the contents have been compiled or derived from sources believed to be reliable and that contain information and opinions that are accurate and complete; however, Cantor makes no representation or warranty, express or implied, in respect thereof, takes no responsibility for any errors and omissions which may be contained herein and accepts no liability whatsoever for any loss arising from any use of or reliance on this report or its contents. Information may be available to Cantor that is not herein. This report is provided, for informational purposes only, to institutional investor clients of Cantor Fitzgerald Canada Corporation, and does not constitute an offer or solicitation to buy or sell any securities discussed herein in any jurisdiction where such offer or solicitation would be prohibited. This report is issued and approved for distribution in Canada, CFCC., a member of the Investment Industry Regulatory Organization of Canada (“IIROC”), the Toronto Stock Exchange, the TSX Venture Exchange and the CIPF. This report is has not been reviewed or approved by Cantor Fitzgerald & Co., a member of FINRA. This report is intended for distribution in the United States only to Major Institutional Investors (as such term is defined in SEC 15a-6 and Section 15 of the Securities Exchange Act of 1934, as amended) and is not intended for the use of any person or entity that is not a major institutional investor. Major Institutional Investors receiving this report should effect transactions in securities discussed in the report through Cantor Fitzgerald & Co. Non US Broker Dealer 15a-6 disclosure: This report is being distributed by (CF Canada/CF Europe/CF Hong Kong) in the United States and is intended for distribution in the United States solely to “major U.S. institutional investors” (as such term is defined in Rule15a-6 of the U.S. Securities Exchange Act of 1934 and applicable interpretations relating thereto) and is not intended for the use of any person or entity that is not a major institutional investor. This material is intended solely for institutional investors and investors who Cantor reasonably believes are institutional investors. It is prohibited for distribution to non-institutional clients including retail clients, private clients and individual investors. Major Institutional Investors receiving this report should effect transactions in securities discussed in this report through Cantor Fitzgerald & Co. This report has been prepared in whole or in part by research analysts employed by non-US affiliates of Cantor Fitzgerald & Co that are not registered as broker-dealers in the United States. These non-US research analysts are not registered as associated persons of Cantor Fitzgerald & Co. and are not licensed or qualified as research analysts with FINRA or any other US regulatory authority and, accordingly, may not be subject (among other things) to FINRA’s restrictions regarding communications by a research analyst with a subject company, public appearances by research analysts, and trading securities held by a research analyst account.
Potential conflicts of interest The author of this report is compensated based in part on the overall revenues of Cantor, a portion of which are generated by investment banking activities. Cantor may have had, or seek to have, an investment banking relationship with companies mentioned in this report. Cantor and/or its officers, directors and employees may from time to time acquire, hold or sell securities mentioned herein as principal or agent. Although Cantor makes every effort possible to avoid conflicts of interest, readers should assume that a conflict might exist, and therefore not rely solely on this report when evaluating whether or not to buy or sell the securities of subject companies. Disclosures as of May 7, 2025 Cantor has not provided investment banking services or received investment banking related compensation from West Red Lake Gold Mines Ltd. within the past 12 months. The analysts responsible for this research report do not have, either directly or indirectly, a long or short position in the shares or options of West Red Lake Gold Mines Ltd. The analyst responsible for this report has visited the material operations of West Red Lake Gold Mines Ltd. No payment or reimbursement was received for related travel costs. Analyst certification The research analyst whose name appears on this report hereby certifies that the opinions and recommendations expressed herein accurately reflect his personal views about the securities, issuers or industries discussed herein. Definitions of recommendations BUY: The stock is attractively priced relative to the company’s fundamentals and we expect it to appreciate significantly from the current price over the next 6 to 12 months. BUY (Speculative): The stock is attractively priced relative to the company’s fundamentals, however investment in the security carries a higher degree of risk. HOLD: The stock is fairly valued, lacks a near term catalyst, or its execution risk is such that we expect it to trade within a narrow range of the current price in the next 6 to 12 months. The longer term fundamental value of the company may be materially higher, but certain milestones/catalysts have yet to be fully realized. SELL: The stock is overpriced relative to the company’s fundamentals, and we expect it to decline from the current price over the next 6 to 12 months. TENDER: We believe the offer price by the acquirer is fair and thus recommend investors tender their shares to the offer. UNDER REVIEW: We are temporarily placing our recommendation under review until further information is disclosed. Member-Canadian Investor Protection Fund. Customers’ accounts are protected by the Canadian Investor Protection Fund within specified limits. A brochure describing the nature and limits of coverage is available upon request.

( Companies Mentioned: WRLG:TSX.V; WRLGF:OTCQB; FRA:UJO,
)
RANKED: World’s top 20 largest gold mines Mining.com
Why Gold, Mining Stocks Are Some of The Few Assets Falling Monday Investopedia
Mercury fuels gold mining in Senegal. And it’s poisoning the people who use it The Seattle Times
Barrick Gold Changed Its Name and Ticker. The CEO Sees Gains From Copper. Barron’s