Gold mining suspended in Peru’s north after 13 miners killed Reuters
Category: Gold
Source: Michael Ballanger 05/05/2025
Michael Ballanger of GGM Advisory Inc. defines “bull trap” and explains his thoughts on the current state of the market.

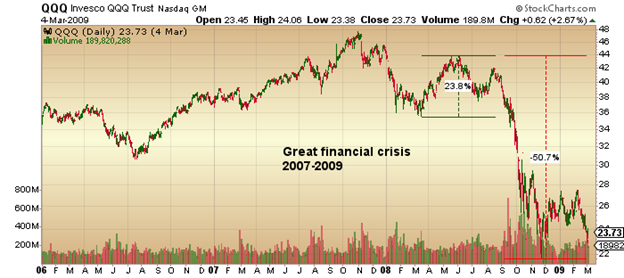
After 48 years in and around the capital markets, I vividly remember two of three major stock market crashes in my career, plus one just as nasty in the precious metals. The October 1987 Crash was the first one since 1929 and caught everyone off balance. It came out of the blue on a Friday afternoon but ended with a great deal of red on the following “Black Monday,” dropping 23.8% in a single session.
The 2001 Dotcom crash wasn’t really a crash per se, but rather a popped bubble that was pretty much contained to the dotcom stocks. The 2020 Covid Crash was maddening beyond belief because it came out of Asia and was accompanied by the most inept government response imaginable as they shut down the world supply of everything while dumping helicopter loads of freshly-inked cash into any bank account that would take it (and then wondered why there was 9% inflation one year later). Those three involved massive stock losses followed by relatively rapid recoveries, but the one that sticks in my mind is the Great Financial Crisis (nee “Bailout”) of 2007-2009.
Also called “the sub-prime meltdown,” I recall speaking with a novice institutional trader with one of the boutique hedge funds located in downtown Toronto as this fuzzy-cheeked kid was asking me with a quivering voice: “What are you going to do for a living, now, Mike?”
You see, he was leveraged out the ying-yang and was being forced by the prime broker to liquidate a bunch of securities upon which there were virtually no bids. Junior technology issues that were trading at $10.00 a share doing a couple of millions shares a day volume that went to $0.50 and stayed there for most of the final quarter of 2008. The poor child had never gone through anything like this before because, you see, nobody had explained to him after he had written the Canadian Securities Course that stocks could actually go down instead of up.
Terribly upset verging on breaking down, he kept asking me how I was going to survive when I finally decided on a “tough love” approach to whining and said: “Ben, what were you doing in October 1987?” to which he replied “I was four years old, how should I know?”
I said “the first thing you do is put on your Big Boy pants and suck it up!” and then described the Crash of ’87 to him and how I was asking everyone around me 20 years earlier what I should do and who I should call and reminded him that about a year later, the markets recovered pretty much everything that they had lost.
Needless to say, there was a muffled “thanks,” after which I heard a “click” and then nothing for about a month.
If there is one thing I know to be true about the investment business, it is that the longer you are in it, the less impact events have on your behavior. In October ’87, I was jumping around like a scalded cat; in 2008, I was an offended victim; in 2020, I was simply annoyed; and in the recent “Liberation Day Crash,” I was bemused. Trading acumen is like a fine bottle of wine; the longer it sits idle, the better it goes down.
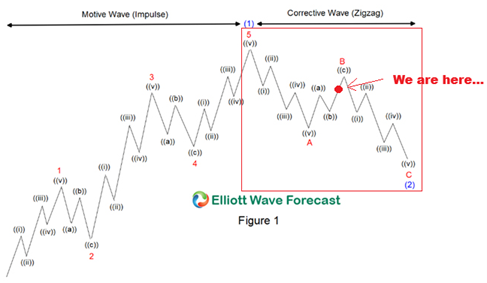
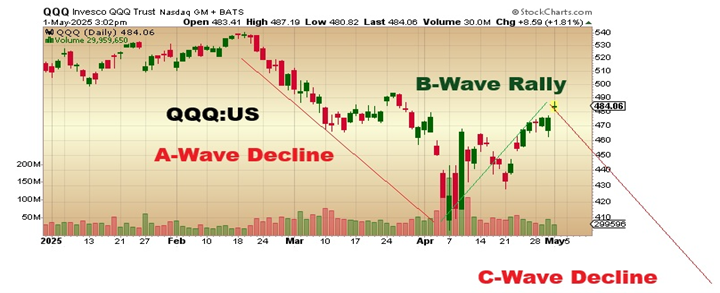
The markets are now in the midst of the dreaded and highly dangerous “B Wave” relief rally. History has taught me with sadistic emphasis that the first rally in a secular bear market is always the most dangerous, and it is so for a number of reasons. For the perma-bull, “buy-the-dip” youngsters programmed by Fed manipulation to always expect an institutional rescue package whenever the CNBC anchors start to whine, it is usually short, sharp, and alluring beyond one’s rational control. They buy into the bounce and keep buying until it enters the exhaustion gap, and then into massive FOMO with the masses clamoring to get “long and longer.“
It is also referred to as a “bull trap” and is defined as follows:
A bull trap is a false signal, referring to a declining trend in a stock, index, or other security that reverses after a convincing rally and breaks a prior support level. The move “traps” traders or investors who acted on the buy signal and generates losses on resulting long positions. A bull trap may also refer to a “whipsaw” pattern.
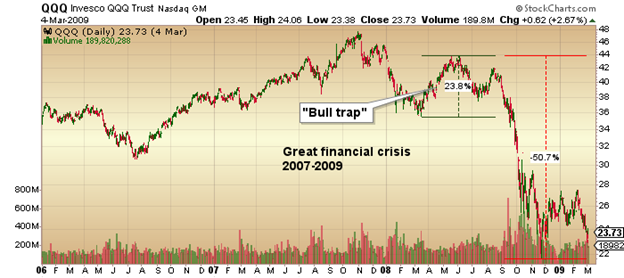
The spring of 2008 was particularly memorable because stocks took off on a 23.8% advance between March and June with then-Fed chairman Ben Bernanke standing in front of the podium and smiling into the cameras that were beaming his professorial visage across the global airwaves telling all that would listen that “the subprime crisis is contained.“
“Contained, I tell you!” Those words were almost as disingenuous as Dr. Fauci in 2020, standing in the same spot and demanding that we all “Trust the science!”
Here is 2025, the new narrative is that there has been a “Zweig Breadth Thrust” which, while sounding like a phrase from an XXX-rated movie, joins the “China deal” narrative, and the “Everything is fine!” narrative completing a near-perfect triad of bullish commentaries that are deemed responsible for this recent advance.
What I urge all readers to remember is that it is not the tariffs that is causing the furor; it is the simple fact that the U.S. is broke. Now, “broke” is not to be confused with “insolvent” because their trading partners are still accepting the greenback in its perpetual state of debasement but with $36 trillion in IOU’s lodged in its windpipe (ex-entitlements), a few percentage points shaved off the Mexican or Canadian tariffs means little when one considers the dreadful state of the American balance sheet. As always, the major theme always comes back around to one word – D-E-B-T. Too much and too late to handle. . .
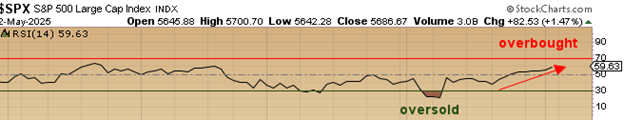
Equity markets can rally for a few more days and a few more percentage points as relative strength for the S&P 500 is still in the “neutral” zone with a reading of 59.63. After covering all hedges after Liberation Day sent stocks crashing, I have already started rebuilding the hedge position in the SQQQ:US failing to remember at my own financial peril that the first rally after a secular peak in prices is always the one that fakes you out. As a card-carrying bear on stocks, it was easy to become enchanted by the whining and wailing in the financial media and in the Twitterverse and Blogosphere. So be it. New lows by summer, that’s my call.
Gold (and Silver)
There is a phenomenon that occurs whenever I am on the public record as a near-term bear on gold and a devout cynic on silver. My inbox becomes deluged with “hate mail.
If I read or hear the phrase “You just don’t get it” one more time, I am going to start hitting the “Block Sender” button on my Outlook tab. A few weeks ago, I went on the record in writing:
“The trend line for gold has indeed moved from ‘gradual’ to ‘vertical’ and is now approaching the terminus of the advance. Now, it doesn’t provide me with any clues as to what the exact price will be the top of the advance; it only tells me that in terms of the X-Axis — time — a near-term top is close.” Since I tend to “eat my own cooking,” as they say, I began building a short position in gold via the GLD May $300 puts which I sold on Friday taking a decent profit and then legged out to the GLD June $290 puts.
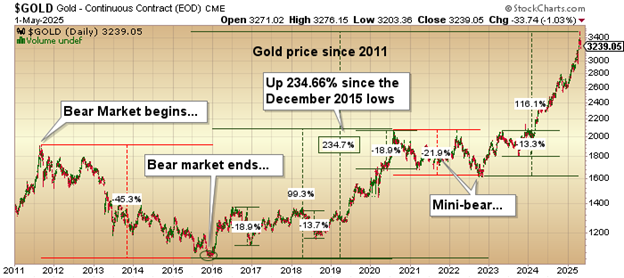
From the chart posted above, you can see that the low that gold touched in late 2015, around $1,045, marked the start of this grand bull market that until recently was off most portfolio managers’ radar screens. However, since the arrival of 2025, gold has moved from “most hated” to “most loved” in terms of sentiment. The CNBC crowd are now calling gold the “most crowded” of all the trades out there but a four-month bull market cannot possibly be seen as “crowded” when we are coming off four years of Mag Seven dominance that included the creation of several dozen “leveraged NVidia” and “triple-leveraged MicroStrategy” ETF’s that everyone and their freckle-faced nephew just had to own.
Since 2015, there have been four corrections in gold of between 13.3% and 18.9%, with one min-bear decline of 21.9% in 2020-2021. If I take $3,509.90 as the near-term top, a correction of 21.9% takes gold down to $2,741.23 while a 13.3% correction takes it to $3,043.08.
Midpoint between those two corrections is $2,892.15. with June gold closing the week at $3,247.40, it is $262.50 off the April 22 high. The trend line is no longer moving in a vertical blow-off direction; it is correcting the excesses of the prior move. The metamorphosis from “gradual” to “vertical” was the signal resulting in the “terminus” of the move.
The big news event on Thursday was that the PBOC sold one million ounces exactly one week after making the purchase, and while the two price points are unknown, it was a profitable trade and one that would make the bullion bank behemoths over at J.P. Morgan extremely proud, verging on insanely envious. So much for the Chinese “never selling” . . .
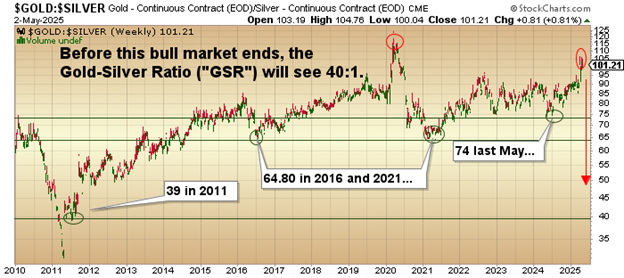
For the silver market, all that needs to be watched is the GSR (“Gold-to-silver ratio”), which stands at end-of-week at 101.21, which confirms the corrective phase we are in and keeps me from engaging in any silver shenanigans in either futures or options. I remain a longer-term bull on silver, but I will refrain from entering into any major positions until after gold completes this corrective move, which I would guess will be the end of May. If it fails to grab by then, I will look to mid-August as my possible entry level.
I am in the process of accumulating positions in a couple of junior silver explorer/developer names with one that stands out because of it management team. If the final wave that takes the precious metals bull market to its final terminus kicks in by mid-year, I believe that silver and the junior gold-silver developers will lead the advance.
I want to be positioned before the rally begins because once silver becomes topical and “in favor,” it morphs into the mania phase far faster and more violently than crypto could ever dream to. (Only subscribers get the first kick at the silver chalice, I might add. . .)
Juniors and the Need for Education
One of my many failings as I rumble through the ever-dimming twilight of what has been a wonderfully exciting career is forgetting at great peril to my reputational capital that not everyone understands mineral exploration and development. Geology-101 was a “must” for every wild-eyed speculator in the 80’s and 90’s but that was replaced in the post-GFC period of 2007-2009 with “Cannabis-101” and then “Crypto-101” and finally “AI-101” as new manias replaced mineral exploration as the “Speculation of Choice.“
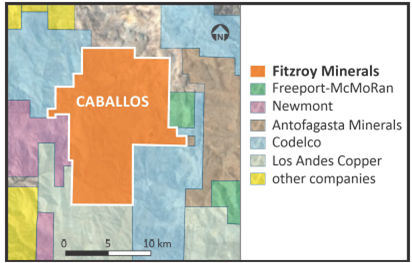
This morning I had a discussion with the Chairman of Fitzroy Minerals Inc. (FTZ:TSX.V; FTZFF:OTCQB) (Campbell Smyth), whose recent Caballos copper-molybdenum discovery was “world-class” in calibre. It was a 200-meter intercept from surface of 0.88% Cu-Eq mineralization (with a big molybdenum credit) with an enriched 42-meter core that ran 2.31% Cu-Eq grade, a barnburner by any and all measures.
That was the topic of discussion in matters relating to both recovery rates and grade, as this clip, showing an interchange between CEO Merlin Marr-Johnson and COO Gilberto Schubert, reveals.
As I was getting more and more excited about the implications of having only one type of mineralization from surface to the bottom of the hole — as in “a perfectly preserved sulphide ore body” — I suddenly realized that while it is easy for me to filter through the noise and make the connection to how the absence of oxide mineralization will be of great benefit to recovery rates and ultimate mineable grade, not everyone has the background to interpret this.
By example, there is a big drill program ongoing at a second major project (Buen Retiro) where their Phase One program for 2025 is to define the oxide cap tForhat has been previously identified by way of 33,000 meters of previous drilling.
Unlike Caballos, Buen Retiro is expected to yield copper-bearing mineralization exclusively from oxide material where technologies such as heap-leaching and SX-EW (” solvent-extraction-electrowinning”) can process the copper ore very economically, such that a grade of 0.2% Cu would constitute a break-even while 0.5% Cu would be considered “high-grade” and grades above 0.5% Cu deemed “spectacular.“
Now, here is my dilemma. The average speculator these days is a) not well-versed in geological mumbo-jumbo such as “oxides” and “sulphides” and b) unaware of the grade requirement differential between sulphides and oxides.
So, after just getting a world-class drill hole with grades of 2.31% Cu-Eq lighting the world on fire (despite a near 50% correction due to the Tariff Tantrums that arrived two days after the news release), how might they respond if the company reports grades expected to be, say, 0.5%? The 2.31% at Caballos is a far cry from the 0.5% (or better) anticipated at Buen Retiro with my greatest fear being that the discrepancy between the two numbers will be judged as a “disappointment” when in fact 0.5% in oxides would be considered a huge “win” by most geologists experienced in the oxide copper recovery business.
I suggested a press release where management could inform shareholders of this important difference between what is going on at Caballos versus developments at Buen Retiro but with the regulators being quite sticky about “forward-looking statements” these days, it seems that the best that can be hoped for is publications like this helping to educate the masses as to the substantial potential of this two-property juggernaut called Fitzroy Minerals Inc.
A third project — a gold-silver-copper project called Polimet has just completed drilling with assays pending. Recommencement of drilling at Caballos in a few more days should light the speculative lamp once confirmed. A lot going on for all shareholders. . .
Personally, I was at once both mystified and infuriated that FTZ/FTZFF sold off nearly 50% within days of the news release. Caballos drill hole CABDDH-001 was world-class in all aspects. Back in the day when traders and investors loved the mining exploration business, the stock would have (and should have) doubled to $0.75 or greater, but instead traded down to $0.20.
Now that the stock is deservedly on its way back to the $0.30’s again, I guess I should be grateful for the combined ignorance of the investment community as I was able to accumulate a few large chunks of stock in the $0.20-$0.22 range while I was in the U.K. trying my damnedest to navigate the Trump-inspired crash. FTZ/FTZFF is one of those rare jewels that one encounters only from the blessings of the Two Goddesses of the Mining World – Lady Luck and Mother Nature, who decided that Caballos deserved royal anointment.
Sign up for our FREE newsletter at: www.streetwisereports.com/get-news
Important Disclosures:
- As of the date of this article, officers and/or employees of Streetwise Reports LLC (including members of their household) own securities of Fitzroy Minerals Inc.
- Michael Ballanger: I, or members of my immediate household or family, own securities of: Fitzroy Minerals Inc. My company has a financial relationship with Fitzroy Minerals Inc. I determined which companies would be included in this article based on my research and understanding of the sector.
- Statements and opinions expressed are the opinions of the author and not of Streetwise Reports, Street Smart, or their officers. The author is wholly responsible for the accuracy of the statements. Streetwise Reports was not paid by the author to publish or syndicate this article. Streetwise Reports requires contributing authors to disclose any shareholdings in, or economic relationships with, companies that they write about. Any disclosures from the author can be found below. Streetwise Reports relies upon the authors to accurately provide this information and Streetwise Reports has no means of verifying its accuracy.
- This article does not constitute investment advice and is not a solicitation for any investment. Streetwise Reports does not render general or specific investment advice and the information on Streetwise Reports should not be considered a recommendation to buy or sell any security. Each reader is encouraged to consult with his or her personal financial adviser and perform their own comprehensive investment research. By opening this page, each reader accepts and agrees to Streetwise Reports’ terms of use and full legal disclaimer. Streetwise Reports does not endorse or recommend the business, products, services or securities of any company.
For additional disclosures, please click here.
Michael Ballanger Disclosures
This letter makes no guarantee or warranty on the accuracy or completeness of the data provided. Nothing contained herein is intended or shall be deemed to be investment advice, implied or otherwise. This letter represents my views and replicates trades that I am making but nothing more than that. Always consult your registered advisor to assist you with your investments. I accept no liability for any loss arising from the use of the data contained on this letter. Options and junior mining stocks contain a high level of risk that may result in the loss of part or all invested capital and therefore are suitable for experienced and professional investors and traders only. One should be familiar with the risks involved in junior mining and options trading and we recommend consulting a financial adviser if you feel you do not understand the risks involved.

( Companies Mentioned: FTZ:TSX.V; FTZFF:OTCQB,
)
Source: Streetwise Reports 05/05/2025
Goliath Resources Ltd. (GOT:TSX.V; GOTRF:OTCQB; B4IF:FSE) pushes big gold gains in British Columbia’s Golden Triangle with high-grade discoveries, strategic investment, and major upside ahead. Read more to explore why investors are watching this gold explorers next moves closely.
Goliath Resources Ltd. (GOT:TSX.V; GOTRF:OTCQB; B4IF:FSE) has engaged world-renowned JDS Energy & Mining Inc. to evaluate the feasibility, permitting, and development of an underground exploration adit at the Surebet Discovery, located within its fully controlled Golddigger property in British Columbia’s Golden Triangle. According to the company, the adit will provide underground access to the Bonanza Zone, allowing for underground drilling to confirm geological details and potentially enable bulk sampling of this high-grade lode.
Previously reported drill results at Surebet include GD-24-260, which returned 34.52 grams per tonne gold equivalent (g/t AuEq) over 39 meters, including 132.93 g/t AuEq over 10 meters and 166.04 g/t AuEq over 8 meters.
Goliath’s founder and CEO, Roger Rosmus, stated that the adit “would cut through the high-grade gold Bonanza Zone, where we have reported many holes with mineable widths and grades over 1 oz/T AuEq,” adding that it would also reduce total drilling costs and allow for exploration year-round.
The Golddigger property spans 91,518 hectares in the Eskay Rift region and lies within 3 kilometers of the Red Line, a critical geological marker separating Triassic Stuhini and Jurassic Hazelton rocks that hosts several of Canada’s major gold, copper, and silver deposits. The Surebet system has delivered consistent results across more than 92,000 meters of drilling since 2021, with 100% of holes intercepting mineralization across a mineralized area of 1.8 square kilometers. Metallurgical work has demonstrated gold recoveries of 92.2%, with nearly half recoverable as free gold without cyanide. The site is near existing infrastructure, including a permitted mill site, tidewater barge access, and roads leading to regional hubs such as Kitsault and Prince Rupert.
JDS Energy & Mining, founded in 2004, has a track record of delivering mining project solutions from design to operations across Canada, including the Minto, Gahcho Kué, and Silvertip mines. Goliath is also an active supporter of CASERM (Center to Advance the Science of Exploration to Reclamation in Mining), a research collaboration between Colorado School of Mines and Virginia Tech, which has contributed to geological studies at Surebet. Quinton Hennigh (Ph.D., P.Geo.), technical advisor to Goliath, is the qualified person responsible for the technical content in the company’s releases.
Gold Sector Gains Strength Amid Economic Shifts and Record Prices
According to a May 2 report from FX Street, gold prices gained positive traction and moved away from a two-week low as the US dollar weakened and investors awaited the US Nonfarm Payrolls report.
The report stated that “repositioning trade ahead of the release of the U.S. Nonfarm Payrolls (NFP) report acts as a tailwind for the non-yielding yellow metal.” FX Street also noted that although the optimism around possible U.S.-China trade negotiations supported a positive risk tone, this may have held back traders from placing fresh bullish bets on gold.
According to a March 11 report from Red Cloud Securities, analyst Taylor Combaluzier maintained a Buy (Speculative) rating on the company and raised the target price to CA$2.90 per share.
Also on May 2, Barry FitzGerald wrote for Stockhead that record gold prices, with the Australian gold price exceeding AU$5,000 per ounce, created “a once in a lifetime opportunity” for junior gold companies to bring small brownfield deposits into production. FitzGerald emphasized that at such prices, even modest resource bases had become “meaningful stuff” for junior explorers aiming to rapidly advance to production and use cash flow to support further exploration.
In a May 4 article for Ahead of the Herd, the author highlighted concerns that the US economy was entering a stagflationary period, marked by slowing growth and persistent inflation. The article referenced economist Stephen Roach, who warned that “a prolonged period of stagflation” could result from current economic policies and global trade tensions. Frank Holmes was quoted in the same piece, stating that many investors saw gold as “a classic fear trade that retail investors are still sorely underexposed to.” Ahead of the Herd further reported that during past stagflationary periods, such as the 1970s, gold had significantly outperformed equities, underscoring its historical role as a defensive asset during times of economic and geopolitical uncertainty.
Analysts Cite Strong Investment Potential
Red Cloud Securities analyst Taylor Combaluzier noted in an April 24 research report that recent assays from Golddigger “have continued to impress,” with high-grade results in known zones and confirmation of gold mineralization in new targets.
Highlights included intercepts of 4.34 g/t Au eq over 8m and 6.91 g/t Au eq over 5m in the Surebet zone, as well as 7.33 g/t Au eq over 13.1m and 5.91 g/t Au eq over 5m in the Bonanza zone. Red Cloud estimated these two zones alone could host about 4,000,000–6,000,000 ounces grading 6.62 g/t Au eq, with further exploration potential at targets like Jackpot and Treasure Island.
Combaluzier also pointed to McEwen Mining Inc.’s CA$10 million strategic investment, giving it a roughly 5.4% stake, calling it “an important endorsement for the company.”
Jay Taylor described Goliath’s progress as “just amazing” in his April 25 Hotline newsletter, highlighting potential for a large-scale intrusive gold system similar to Snowline Gold Corp.’s (SGD:TSX.V; SNWGF:OTCQB) Valley deposit. In the same interview, Dr. Quinton Hennigh describes the newly discovered reduced intrusive related gold (RIRG) as “we have a new beast in the Golden Triangle”.
Zacks Small-Cap Research analyst Ronald Wortel called Goliath “a highly compelling investment in the gold exploration market,” noting its exposure to gold, silver, and copper resource exploration. Wortel’s valuation suggested 10,000,000 million ounce potential and a possible 190% return from current share price levels.
According to a March 11 report from Red Cloud Securities, analyst Taylor Combaluzier maintained a Buy (Speculative) rating on the company and raised the target price to CA$2.90 per share, reflecting a 65% return to target. The firm estimated a mineral inventory of approximately 4.0 to 6.0 million ounces gold equivalent (AuEq) at 6.62 grams per tonne from the Surebet and Bonanza Zones, using long-term pricing of US$2,400 per ounce gold.
Combaluzier wrote that 2024 drilling “continued to demonstrate continuity of high grades at known zones and confirmed Au mineralization at new targets,” highlighting intercepts like 4.34 g/t AuEq over 8 meters and 7.33 g/t AuEq over 13.1 meters. Red Cloud emphasized that all twelve identified gold-rich layers at Surebet remained open for expansion and that Bonanza showed strong gold mineralization with further upside.
The report also called McEwen Mining’s CA$10 million strategic investment, giving it a 5.4% stake, “an important endorsement for the company.” Combaluzier concluded that the company traded at a discount to peers and suggested further positive exploration results could help close that gap.
Advancing the Roadmap: Goliath’s 2025 Catalysts
According to Goliath’s April 2025 investor presentation, the company is positioned for a low-risk expansion phase in 2025, leveraging its 100% control over the Golddigger property, the strength of its strategic shareholders, and its track record of drilling success. Goliath has drilled 92,000 meters over four seasons, including 35,000 meters in 2024, and reported that 92% of the 2024 drill holes contained visible gold. The company controls 56 kilometers of the Red Line and recently expanded its land package by 28% to 91,518 hectares to cover additional exploration targets such as the Blue Origin Reduced Intrusion-Related Gold System (RIRGS).
The company’s financial position includes a market capitalization of approximately CA$322 million, with CA$68 million raised over the past three years. Major cornerstone shareholders include Crescat Capital, McEwen Mining Inc. (TSX: MUX, NYSE: MUX), Rob McEwen, Eric Sprott, a Global Commodity Group based in Singapore, and Larry Childress. [OWNERSHIP_CHART-9595]
As Goliath prepares for its aggressive 2025 exploration program, it plans to relog approximately 44historic holes of reduced intrusion related (RIRG) dykes that may contain high-grade gold encompassing roughly 1,400 meters of new samples for early assaying. The updated geological model, developed in collaboration with partners including Archer, Cathro & Associates and Colorado School of Mines supports ongoing targeting of high-grade RIRG feeder dykes and the expansion of the Surebet system, positioning the company for potential new discoveries and resource development milestones in the year ahead.
Ownership and Share Structure
According to company data, 19.0% of Goliath Resources is held by Management, Team, and Insiders. Strategic and Institutional investors collectively own 9.9%, with notable holdings including Crescat Capital LLC at 14.4%, McEwen Mining (NYSE: MUX), a Global Commodity Group based in Singapore at 5.2%, Mr. Rob McEwen at 3.9%, Mr. Eric Sprott at 3.0%, and Mr. Larry Childress at 1.0%. The remaining shares are held by other institutional funds and retail investors.
Goliath has 150,546,300 shares issued and outstanding. The 52-week range of Goliath is CA$0.81 to CA$2.87.
Sign up for our FREE newsletter at: www.streetwisereports.com/get-news
Important Disclosures:
- Goliath Resources Ltd. is a billboard sponsor of Streetwise Reports and pays SWR a monthly sponsorship fee between US$4,000 and US$5,000.
- As of the date of this article, officers and/or employees of Streetwise Reports LLC (including members of their household) own securities of Snowline Gold Corp.
- James Guttman wrote this article for Streetwise Reports LLC and provides services to Streetwise Reports as an independent contractor.
- This article does not constitute investment advice and is not a solicitation for any investment. Streetwise Reports does not render general or specific investment advice and the information on Streetwise Reports should not be considered a recommendation to buy or sell any security. Each reader is encouraged to consult with his or her personal financial adviser and perform their own comprehensive investment research. By opening this page, each reader accepts and agrees to Streetwise Reports’ terms of use and full legal disclaimer. Streetwise Reports does not endorse or recommend the business, products, services or securities of any company.
For additional disclosures, please click here.

( Companies Mentioned: GOT:TSX.V; GOTRF:OTCQB; B4IF:FSE,
)
Source: Craig Stanley 05/05/2025
AbraSilver Resource Corp. (ABRA:TSX; ABBRF:OTCQX) discussed these and other aspects of Diablillos during a recent site visit for analysts, noted a Raymond James report.
AbraSilver Resource Corp. (ABRA:TSX; ABBRF:OTCQX) recently hosted several analysts at its Diablillos silver-gold project in Argentina, among them Raymond James’ Craig Stanley, who reported the highlights in an April 14 research note.
“We believe Diablillos is one of the best undeveloped silver projects not held by a producer,” Stanley wrote. “In addition to strong economics, the project benefits from recent political changes in Argentina that will provide tax, customs and currency exchange incentives.”
A handful of AbraSilver representatives were on site for the visit, noted Stewart. They were Chief Executive Officer John Miniotis, Chief Geologist David O’Connor, Senior Vice President of Projects and Development Jeremy Weyland, Country Manager Eugenio Ponte, and Directors Sam Leung and Hernan Zaballa.
Stanley summarized the information AbraSilver provided during the event.
Between Two Provinces
To reach Diablillos, 160 kilometers (160 km) southwest of the city of Salta in northwest Argentina, the site visitors flew to an airstrip at Pohang Iron and Steel Co.’s (POSCO’s) Sal de Oro lithium mine and drove 20 minutes to AbraSilver’s camp. After the site visit, visitors drove the 5½ hours back to Salta.
Diablillos is in a disputed zone between the Salta and Catamarca provinces that recently made an agreement regarding Sal de Oro, in the same area. It indicates that the provinces will equally share the project’s royalties and taxes, to be overseen by an interprovincial authority, including officers from both jurisdictions.
AbraSilver formally has requested a similar agreement for Diablillos, expected in H1/25.
“This agreement is a precedent for Diablillos, establishing a mechanism to deal with issues until the border conflict is resolved by the National Congress,” Stanley wrote.
Water and Power
As outlined in the prefeasibility study (PFS), noted the analyst, water is available from the aquifer 17 kilometers (17 km) from the Diablillos site; currently, the company has permission to use it for exploration. Management is seeking additional water resources to support an increased throughput rate.
Also as outlined in the PFS, Diablillos is to be powered by a combination diesel-solar power plant, with natural gas being an alternative to diesel. The diesel component will power the site. The solar component would provide 3 megawatts (3 MW) of power for the camp plus battery storage, or would provide 17 MW of power without batteries.
A potential future project could also provide power to Diablillos, noted Stanley. AbraSilver’s largest shareholder, Central Puerto and another large power producer, YPF Luz, are considering building a US$600 million (US$600M), high-voltage line to supply up to 400 MW of renewable energy to mining companies in northwestern Argentina. The proposed powerline would be 15 km from Diablillos. Construction, according to YPF Luz, is to start in 2028.
Along with additional water rights and grid power, other ways AbraSilver is looking to enhance Diablillos include a revised mine plan encompassing stepout drill results, contract mining, co-disposal of waste rock with tailings and a standalone heap-leach mine. These will be examined in the upcoming feasibility study.
Resource Growth Potential
The current Diablillos resource amounts to 266,000,000 ounces of silver equivalent (266 Moz of Ag eq) at 147 grams per ton (147 g/t), or 151 Moz silver at 83 g/t plus 1.4 Moz gold at 0.8 g/t.
Further drilling, especially in three particular zones, potentially could expand the resource, reported Stanley. These zones are the JAC Extension, south and southwest of the proposed JAC open pit; the Oculto Northeast target; and the Sombra Target, 250 meters (250m) south of the proposed Oculto pit.
Changes in Argentina
Under President Javier Milei, who took office in December 2023, business sentiment in Argentina has significantly increased.
As for recent developments, earlier in March, the International Monetary Fund approved a 48-month, US$20 billion (US$20B), extended fund facility arrangement. The World Bank and Inter-American Development Bank announced three-year support packages of US$12B and US$10B, respectively.
Today, April 14, Milei ordered lifting of the “el cepo” capital and currency controls initiated in 2019 to stabilize the peso at an official rate and prevent capital from exiting the country. These controls restricted access to U.S. dollars and discouraged foreign investment. Argentina is allowing the peso to trade within a range of 1,000–1,400 pesos per dollar, expanding by 1% each month.
The country, in March, had its 10th consecutive month of disinflation. During this month, the annual inflation rate was 55.9%, down from 66.9% in February and down from about 300% in April 2024.
Argentina’s next legislative elections, to fill half or 127 seats in the Chamber of Deputies and one-third or 24 of the seats in the Senate, will take place in October 2025. As for the outcome, AbraSilver predicted that Milei’s group will, at the least, maintain its foothold, and likely expand it. The country’s next presidential election is in 2027.
Benefitting From RIGI
The biggest impact to date to the mining sector under Milei’s Administration has been and continues to be implementation of RIGI, or Régimen de Incentivo para Grandes Inversiones (Large Investment Incentive Regime), effective starting July 8, 2024, Stanley purported. In September, the province of Salta agreed to formally abide by RIGI.
The regime, primarily to encourage foreign investment in Argentina, offers companies tax, customs and currency exchange incentives.
The total RIGI benefit to AbraSilver, through reduced taxes, royalties and export duties, is an estimated US$430M, according to the updated PFS. To be RIGI eligible, the company must apply by July 2026 and spend 40% of the investment amount (US$191M) within two years of approval (July 2028). Management expects the governmental review of its RIGI application will take several months.
Strong Cash Balance
Last month, AbraSilver made its final property payment to EMX Royalty of CA$6.5M ahead of schedule (the due date is July 31, 2025). As a result, the balance was reduced by CA$7M.
As of March 31, the company had about CA$65M in cash, enough to see it through to project financing in 2026, noted Stanley.
Near-Term Catalysts
AbraSilver has many potential stock-boosting events ahead, Stanley reported. Drill results are expected on an ongoing basis from its 90-hole, phase five diamond drill program, underway with two active rigs and a third to start in the coming weeks. Completion of this campaign is expected by December 2025.
An updated resource estimate is due in H2/25. It will encompass results of the phase four drill program, comprised of 106 holes over 21,172m. Approval of the Environmental Impact Assessment is anticipated in Q4/25.
In Q1/26, a feasibility study of Diablillos, at an estimated cost of CA$11M, is due out, likely to be followed by a construction decision in H2/26.
“We model production commencing in Q3/29,” Stanley wrote.
Stock Details
AbraSilver is rated Outperform by Raymond James.
The mining company has 128.7 million outstanding shares. Its market cap is CA$394M. Its 52-week range is CA$1.78–CA$3.65 per share.
Sign up for our FREE newsletter at: www.streetwisereports.com/get-news
Important Disclosures:
- AbraSilver Resource Corp. is a billboard sponsor of Streetwise Reports and pays SWR a monthly sponsorship fee between US$4,000 and US$5,000.
- Doresa Banning wrote this article for Streetwise Reports LLC and provides services to Streetwise Reports as an independent contractor.
- This article does not constitute investment advice and is not a solicitation for any investment. Streetwise Reports does not render general or specific investment advice and the information on Streetwise Reports should not be considered a recommendation to buy or sell any security. Each reader is encouraged to consult with his or her personal financial adviser and perform their own comprehensive investment research. By opening this page, each reader accepts and agrees to Streetwise Reports’ terms of use and full legal disclaimer. Streetwise Reports does not endorse or recommend the business, products, services or securities of any company.
For additional disclosures, please click here.
Disclosures for Raymond James, AbraSilver Resource Corp., April 14, 2025
Unless otherwise specified, the term “Raymond James” shall denote, where appropriate, Raymond James & Associates, Inc. (RJA), Raymond James Ltd. (RJL), and their affiliates, subsidiaries and related entities. Analyst Information Analyst Compensation: Research analysts and associates at Raymond James are compensated on a salary and bonus system. Several factors enter into the compensation determination for an analyst, including: i) research quality, ii) team productivity, iii) client feedback, iv) rating accuracy, v) overall revenue and profitability levels of the department and firm (a portion of which is generated by investment banking activities) and vi) compensation levels for comparable research analysts at competing firms. Registration of Non-U.S. Analysts: The analysts listed on the front of this report who are not employees of, or associated with, RJA are not registered/qualified as research analysts under FINRA rules and are not subject to FINRA Rule 2241 restrictions on communications with covered companies, trading securities held by a research analyst account, and obligations related to identifying and managing conflicts of interest. This global disclosure considers all entities of Raymond James and its affiliates. The jurisdiction where the analyst(s) is registered will determine what is permitted. For example, if the persons responsible for the content of this report are not licensed as research analysts in accordance with applicable rules promulgated by the regulatory organization(s) where this report is distributed, any client wishing to effect trades in any security should contact their Raymond James representative. The analyst Craig Stanley, primarily responsible for the preparation of this research report, attests to the following: (1) that the views and opinions rendered in this research report reflect his or her personal views about the subject companies or issuers and (2) that no part of the research analyst’s compensation was, is, or will be directly or indirectly related to the specific recommendations or views in this research report. Craig Stanley of Raymond James Ltd. is a non-US Analyst Company Specific Disclosures Methodology: The Raymond James methodology for assigning ratings and target prices includes a number of qualitative and quantitative factors, including an assessment of industry size, structure, business trends, and overall attractiveness; management effectiveness; competition; visibility; financial condition; and expected total return, among other factors. Collectively, these factors are subject to change depending on overall economic conditions or industry- or company-specific occurrences. Target Prices: The information below indicates Raymond James’ target price and rating changes for any subject companies over the past three years.
Valuation Methodology AbraSilver Resource Corp. Our target price is based on the NPV of the Diablillos Project and net financial assets. General Risk Factors Following are some general risk factors that pertain to the businesses of the subject companies and the projected target prices and recommendations included on Raymond James research: (1) Industry fundamentals with respect to customer demand or product/service pricing could change and adversely impact expected revenues and earnings; (2) issues relating to major competitors or market shares or new product expectations could change investor attitude toward the sector or this stock; (3) Unforeseen developments with respect to the management, financial condition or accounting policies or practices could alter the prospective valuation. Company Specific Risk Factors AbraSilver Resource Corp. Volatility in metal prices, foreign exchange markets and investor interest in mining equities could affect financing, capital spending and exploration decisions that may impact the company’s valuation and subject shares to price volatility. Financing risk: ABRA does not generate cash flow and is dependent on outside sources of financing. In the future, the company may not be able to raise money due to market conditions or may do so at a price that is dilutive to existing shareholders. Technical risk: Mining is risky and unforeseen issues could materially impact tonnes, grades, recoveries, and costs as outlined in the 2024 PFS study. Future commodity prices, costs, and technical studies may not prove resources or reserves economic. Political and regulatory risk: Changes in government and/or policies could lead to revised mining laws and taxes. Legislative elections are scheduled to be held in Argentina in October 2025 in which half of the seats in the Chamber of Deputies and a third of the seats in the Senate will be elected. The next presidential election is scheduled for 2027. Employee/personnel risk: If the market becomes more favourable to mining and the demand for skilled personnel materially increases, the company may not be able to retain key employees and contractors. Liquidity and volatility risk: ABRA’s shares are relatively illiquid compared to large-cap equities and even minor changes in precious metal prices would likely result in price volatility. Climate Change Risk: The physical risks of climate change, such as extreme weather events, could adversely impact operations. As well, concerns around climate change may affect the share price if investors divest interests in industries that are perceived to have environmental impacts.
Relationship Disclosures The person(s) responsible for the production of this report declare(s) that, as far as they are aware, there are no relationships or circumstances (including conflicts of interest) that may in any way impair the objectivity of this recommendation directly or indirectly. This statement applies equally to any persons closely associated with him or her. However, it is possible that persons making communications in relation to a security may have a holding in that security and this will be disclosed. As stated, Raymond James has controls in place to manage such risks. In the event that this is a compendium report (i.e., covers six or more subject companies), Raymond James may choose to provide specific disclosures for the subject companies by reference. To access these disclosures, clients should refer to: raymondjames.bluematrix.com/sellside/ Disclosures.action or call toll free at 1.800.237.5643 in the United States or 1.800.667.2899 in Canada. In other jurisdictions, please contact your local Raymond James’ representative. Company Name Disclosure AbraSilver Resource Corp. Raymond James Ltd. has managed or co-managed a public offering of securities within the last 12 months with respect to the issuer. AbraSilver Resource Corp. Raymond James Ltd. has provided investment banking services within the last 12 months with respect to the issuer. AbraSilver Resource Corp. Raymond James Ltd. has received compensation for investment banking services within the past 12 months with respect to the issuer.
Investor Disclosures In the United States (or U.S.), RJA is registered with the Financial Industry Regulatory Authority (FINRA) as a member firm. RJA is responsible for the preparation and distribution of reports created in the United States. RJA is located at The Raymond James Financial Center, 880 Carillon Parkway, St. Petersburg, Florida 33716 (Raymond James Financial (RJF) Corporate Headquarters), 727.567.1000. Raymond James Financial Services, Inc. (RJFS) is registered with FINRA as a Member Firm. RJFS is located at the RJF Corporate Headquarters. RJA non-U.S. affiliates, which are not FINRA member firms (with the exception of Raymond James (USA) Ltd.), include the following entities, which are responsible for the creation or distribution of reports in their respective areas: In Canada, RJL is registered with the Canadian Investment Regulatory Organization (CIRO) as a member firm. RJL is responsible for the preparation and distribution of reports created in Canada. RJL is located at Suite 2100, 925 West Georgia Street, Vancouver, BC V6C 3L2 (RJL Head Office), 604.659.8200. Raymond James (USA) Ltd. (RJLU) is registered with FINRA as a member firm, which is responsible for the distribution of reports created in Canada and the United States to both American clients living in Canada and Canadian clients living in the United States. RJLU is located at the RJL Head Office. In the United Kingdom, Raymond James Financial International Ltd. (RJFI) and Raymond James Investment Services, Ltd. (RJIS) are authorised and regulated by the Financial Conduct Authority (FCA). RJFI and RJIS are located at Ropemaker Place, 25 Ropemaker Street, London, England, EC2Y 9LY, +44 203 798 5600. This report is not directed to, or intended for distribution to or use by, any person or entity that is a citizen or resident of or located in a locality, state, province, country, or other jurisdiction where such distribution, publication, availability, or use would be strictly prohibited or contrary to law or regulation. The securities discussed in this report may not be eligible for sale in some jurisdictions. This research is not an offer to sell or the solicitation of an offer to buy any security in any jurisdiction where such an offer or solicitation would be illegal. It is not investment advice and does not constitute a personal recommendation, nor does it take into account the particular investment objectives, financial situations, or needs of individual clients. Information in this report should not be construed as advice designed to meet the individual objectives of any particular investor. Investors should consider this report as only a single factor in making their investment decision. Some investments discussed in this report may have a high level of volatility. High volatility investments may experience sudden and large falls in their value causing losses when that investment is realized. Those losses may equal your original investment. Consultation with your Raymond James representative is recommended. Past performance is not a guide to future performance, future returns are not guaranteed, and a loss of original capital may occur. Nothing in this report constitutes investment, legal, accounting or tax advice or is a representation that any investment or strategy is suitable or appropriate to your individual circumstances or otherwise constitutes a personal recommendation to you. The information provided is as of the date above and is subject to change and may or may not be updated. This report should not be deemed a recommendation to buy or sell any security. Certain information has been obtained from third-party sources Raymond James considers reliable, but Raymond James does not guarantee that such information is accurate or complete. Persons within Raymond James may have information that is not available to the contributors of the information contained in this report. Raymond James, including affiliates and employees, may execute transactions in the securities listed in this report that may not be consistent with the ratings appearing in this report. With respect to materials prepared by Raymond James, all expressions of opinion reflect the judgment of the Research Departments of Raymond James, or its affiliates, as of the date above and are subject to change. Raymond James may perform investment banking or other services for, or solicit investment banking business from, any company mentioned in this report. Raymond James reports are disseminated and available to Raymond James clients simultaneously via electronic publication to Raymond James’ internal proprietary websites (RJA: RJ Client Access & raymondjames.com; RJL: RJL ECM Client Access, RJL Retail Client Access & raymondjames.ca). Not all reports are directly distributed to clients or third-party aggregators. Certain maintenance reports may only be disseminated on Raymond James’ internal proprietary websites; however, such reports will not contain changes to target price, valuation, or investment or suitability rating. Individual Raymond James associates may also opt to circulate published reports to one or more clients electronically. This electronic communication distribution is discretionary and is undertaken only after the report has been publicly disseminated via publication to RJ’s internal proprietary websites. The level and types of communications provided by Raymond James associates to clients may vary depending on various factors including, but not limited to, the client’s individual preference as to the frequency and manner of receiving communications. For reports, models, or other data available on a particular security, please contact your Raymond James representative or financial advisor or visit for RJA: RJ Client Access & raymondjames.com; RJL: RJL ECM Client Access, RJL Retail Client Access & raymondjames.ca. Raymond James’ policy is to update reports as it deems appropriate, based on developments with the subject company, the sector or the market that may have a material impact on the research views or opinions stated in a report. Raymond James’ policy is only to publish reports that are impartial, independent, clear, and fair and not misleading. Any information relating to the tax status of the securities discussed in this report is not intended to provide tax advice or to be used by anyone to provide tax advice. Investors are urged to seek tax advice based on their particular circumstances from an independent tax professional. Links to third-party websites are being provided for information purposes only. Raymond James is not affiliated with and does not endorse, authorize, or sponsor any of the listed websites or their respective sponsors. Raymond James is not responsible for the content of any third-party website or the collection or use of information regarding any website’s users and/or members. Raymond James has not reviewed any such thirdparty websites and takes no responsibility for the content contained therein. Such address or hyperlink (including addresses or hyperlinks to Raymond James’ own website material) is provided solely for your convenience and information, and the content of any such website does not in any way form part of this report. Accessing such website or following such link through this report or Raymond James’ website shall be at your own risk. Additional information is available on request. All right, title, and interest in any Raymond James reports is the exclusive property of Raymond James Financial, Inc. and its affiliates, except as otherwise expressly stated. Raymond James® is the registered trademark of Raymond James Financial, Inc. All trademarks, service marks, slogans, logos, trade dress and other identifiers, third-party data and/or market data (“intellectual property”) displayed in the Raymond James reports are the property of Raymond James, or of other parties. The names of other companies and third-party products or services or other intellectual property mentioned in the Raymond James reports may be the copyright, trademarks, or service marks of their respective owners. U.S. and foreign copyright, trademark, common law rights and statutes protect this intellectual property. You are prohibited from using any intellectual property for any purpose including, but not limited to, use on other materials, in presentations, as domain names, or as metatags, without the express written permission of Raymond James or such other party that may own the marks. Notice to RJA PCG Financial Advisors – Non-U.S. securities discussed in this report are generally not eligible for sale in the U.S. unless they are listed on a U.S. securities exchange. This report may not be used to solicit the purchase or sale of a security in any state where such a solicitation would be illegal. By accessing this report, you agree to not solicit the purchase or sale of any security mentioned in the report that is not listed on a U.S. securities exchange, or is not otherwise registered under applicable state Blue Sky laws. Furthermore, you acknowledge that you will be solely responsible for any and all costs associated with the rescission of trades in unregistered securities. Please contact the International Research Liaison with any questions at 727.567.5559. Ratings and Definitions RJA (U.S.) Definitions: Strong Buy (SB1) The security is expected to appreciate, produce a total return of at least 15%, and outperform the S&P 500 over the next six to 12 months. For higher yielding and more conservative equities, such as REITs and certain MLPs, a total return of at least 15% is expected to be realized over the next 12 months. Outperform (MO2) The security is expected to appreciate or outperform the S&P 500 over the next 12-18 months. For higher yielding and more conservative equities, such as REITs and certain MLPs, an Outperform rating is used for securities where Raymond James is comfortable with the relative safety of the dividend and expects a total return modestly exceeding the dividend yield over the next 12-18 months. Market Perform (MP3) The security is expected to perform generally in line with the S&P 500 over the next 12 months and could potentially be used as a source of funds for more highly rated securities. Underperform (MU4) The security is expected to underperform the S&P 500 or its sector over the next six to 12 months and should be sold. Suspended (S) The security’s rating and price target have been suspended temporarily. This action may be due to market events that made coverage impracticable or to comply with applicable regulations or firm policies in certain circumstances. When a security’s research coverage has been suspended, the previous rating and price target are no longer in effect for this security, and they should not be relied upon. RJL (Canada) Definitions: Strong Buy (SB1) The security is expected to appreciate and produce a total return of at least 15% and outperform the S&P/TSX Composite Index over the next six to 12 months. Outperform (MO2) The security is expected to appreciate and outperform the S&P/ TSX Composite Index over the next 12-18 months. Market Perform (MP3) The security is expected to perform generally in line with the S&P/TSX composite Index over the next 12 months and could potentially be used as a source of funds for more highly rated securities. Underperform (MU4) The security is expected to underperform the S&P/TSX Composite Index or its sector over the next six to 12 months and should be sold. Suspended (S) The security’s rating and price target have been suspended temporarily. This action may be due to market events that made coverage impracticable or to comply with applicable regulations or firm policies in certain circumstances or may otherwise have a perceived conflict of interest. When a security’s research coverage has been suspended, the previous rating and price target are no longer in effect for this security, and they should not be relied upon. Coverage Universe Rating Distribution* Investment Banking Relationships RJA RJL RJA RJL Strong Buy and Outperform (Buy) Market Perform (Hold) Underperform (Sell) 571 60% 188 77% 359 38% 56 23% 19 2% 1 0% 89 16% 45 24% 29 8% 6 11% 0 0% 0 0% Total Number of Companies 949 100% 245 100% 118 51 * Columns may not add to 100% due to rounding. * Total does not include companies with a suspended rating. RJA Suitability Ratings (SR) Moderate Risk/Provide Income (M/INC) Larger capitalization, lower volatility (beta) equities of companies with sound financials, consistent earnings, and dividend yields meaningfully above that of the S&P 500. Many securities in this category are structured with a focus on providing a consistent dividend or return of capital. Moderate Risk/Wealth Accumulation (M/ACC) Larger capitalization equities of companies with sound financials, consistent earnings growth, the potential for long-term price appreciation, and often a dividend yield. Moderately Aggressive Risk/ Provide Income (MA/INC) Generally equities of companies that are structured with a focus on providing a dividend meaningfully above that of the S&P 500. These companies typically feature sound financials, positive earnings, and the potential for long-term price appreciation. Moderately Aggressive Risk/Wealth Accumulation (MA/ACC) Generally equities of companies in fast growing and competitive industries with less predictable earnings (or losses), potentially more leveraged balance sheets, rapidly changing market dynamics, and potential risk of principal. Aggressive Risk/Provide Income (A/INC) Generally equities of companies that are structured with a focus on providing a meaningful dividend but may face less predictable earnings (or losses), more leveraged balance sheets, rapidly changing market dynamics, financial and competitive issues, higher price volatility (beta), and meaningful risk of loss of principal. Securities of companies in this category may have a more volatile income stream from dividends or distributions of capital. Aggressive Risk/Wealth Accumulation (A/ACC) Generally equities of companies with a short or unprofitable operating history, limited or less predictable revenues, high risk associated with success, high volatility (beta), potential significant financial or legal issues, and the meaningful risk of loss of principal. RJL Suitability Ratings RJL has developed a proprietary algorithm for risk rating individual securities. The algorithm utilizes data from multiple vendors, and all data is refreshed at least monthly. Accordingly, suitability ratings are updated monthly. The suitability rating shown on this report is current as of the report’s published date. In the event that a suitability rating changes after the published date, the new rating will not be reflected until the analyst publishes a subsequent report. International Disclosures For clients of RJA: Any foreign securities discussed in this report are generally not eligible for sale in the United States unless they are listed on a U.S. exchange. This report is being provided to you for informational purposes only and does not represent a solicitation for the purchase or sale of a security in any state where such a solicitation would be illegal. Investing in securities of issuers organized outside of the United States, including ADRs, may entail certain risks. The securities of non-U.S. issuers may not be registered with, nor be subject to, the reporting requirements of the U.S. Securities and Exchange Commission. There may be limited information available on such securities. Investors who have received this report may be prohibited in certain states or other jurisdictions from purchasing the securities mentioned in this report. Please ask your RJA financial advisor for additional details and to determine if a particular security is eligible for purchase in your state or jurisdiction. For clients of RJFS: This report was prepared and published by Raymond James and is being provided to you by RJFS solely for informative purposes. Any person receiving this report from RJFS should direct all questions and requests for additional information to their RJFS financial advisor. For RJA and RJFS clients in Canada: In the Canadian provinces of Alberta, British Columbia, New Brunswick, Ontario and Quebec (collectively, the “Canadian Jurisdictions”), both RJA and RJFS are relying on the international dealer exemption (the “IDE”), and RJA is also relying on the international adviser exemption (the “IAE”), pursuant to sections 8.18 and 8.26 of National Instrument 31-103 Registration Requirements, Exemptions and Ongoing Registrant Obligations (“NI 31-103”). RJA and RJFS are not registered to make a trade nor is RJA registered to provide advice in the Canadian Jurisdictions. Neither RJA nor RJFS are members of the Investment Industry Regulatory Organization of Canada. This report is intended solely for residents of the Canadian Jurisdictions who are permitted clients as set forth in NI 31-103. Neither RJA, RJFS nor their representatives are making an offer to sell or soliciting an offer to buy any security issued by an issuer incorporated, formed or created under the laws of Canada (“Canadian issuers”) and discussed in this report. Any trades by permitted clients in any securities of Canadian issuers (whether listed on a U.S., Canadian or other exchange) discussed in this report may not be made through a relationship with RJA or RJFS and shall be directed to RJL for execution. Relationships with clients residing in Canadian Jurisdictions for trading in securities of Canadian issuers must be established through a Canadian registered firm, such as RJL. For additional information regarding establishing a relationship with RJL, Canadian clients should contact 1-888-545-6624. For clients of RJL: In the case where there is Canadian analyst contribution, the report meets all applicable CIRO disclosure requirements. RJL is a member of the Canadian Investor Protection Fund. For clients of RJFI: This report is prepared for and distributed by RJFI, and any investment to which this report relates is intended for the sole use of the persons to whom it is addressed, being persons who are Eligible Counterparties or Professional Clients as described in the FCA rules or persons described in Articles 19(5) (Investment professionals) or 49(2) (High net worth companies, unincorporated associations, etc.) of the Financial Services and Markets Act 2000 (Financial Promotion) Order 2005 (as amended) or any other person to whom this promotion may lawfully be directed. It is not intended to be distributed or passed on, directly or indirectly, to any other class of persons and may not be relied upon by such persons and is, therefore, not intended for private individuals or those who would be classified as retail clients. For clients of RJIS: This report is prepared for and distributed by RJIS, and is for the use of professional investment advisers and managers and is not intended for use by retail clients. For purposes of the FCA requirements, this report is classified as independent with respect to conflict of interest management. RJFI and RJIS are authorised and regulated by the FCA. For clients of Raymond James France (RJ France):RJ France is authorised and regulated by the Autorite de Controle Prudentiel et de Resolution and the Autorite des Marches Financiers. As of 30 November, 2020, RJ France is an unaffiliated entity of Raymond James. RJ France is located at SAS, 45 Avenue George V, 75008, Paris, France, +33 1 45 61 64 90. This report is prepared for and distributed by RJ France pursuant to an agreement with Raymond James, and any investment to which this report relates is intended for the sole use of the persons to whom it is addressed, being persons who are Eligible Counterparties or Professional Clients as described in “Code Monetaire et Financier” and Reglement General de l’Autorite des Marches Financiers. It is not intended to be distributed or passed on, directly or indirectly, to any other class of persons and may not be relied upon by such persons and is, therefore, not intended for private individuals or those who would be classified as retail clients. For recipients in Brazil: This is a strictly privileged and confidential communication between Raymond James & Associates and its selected clients. This communication contains information addressed only to specific individuals in Brazil and is not intended for distribution to, or use by, any person other than the named addressee. This communication (i) is provided for informational purposes only, (ii) should not be construed in any manner as any solicitation or offer to buy or sell any investment opportunities or any related financial instruments, and (iii) should not be construed in any manner as a public offer of any investment opportunities or any related financial instruments. If you are not the named addressee, you should not disseminate, distribute, or copy this communication. Please notify the sender immediately if you have mistakenly received this communication. The investments analyzed in this report may not be offered or sold to the public in Brazil. Accordingly, the investments in this report have not been and will not be registered with the Brazilian Securities and Exchange Commission (Comissão de Valores Mobiliários, the “CVM”), nor have they been submitted to the foregoing agency for approval. Documents relating to the investments in this report, as well as the information contained therein, may not be: (i) supplied to the public in Brazil, as the offering of investment products is not a public offering of securities in Brazil; nor (ii) used in connection with any offer for subscription or sale of securities to the public in Brazil. For clients in Australia: Despite anything in this report to the contrary, this report is prepared for and distributed in Australia by RJFI with the assistance of RJA, and RJA at times will act on behalf of RJFI. This report is only available in Australia to persons who are “wholesale clients” (as that term is defined in section 761G of the Corporations Act 2001 (Cth)) and is supplied solely for the use of such wholesale clients and shall not be distributed or passed on to any other person. You represent and warrant that if you are in Australia, you are a “wholesale client”. This research is of a general nature only and has been prepared without taking into account the objectives, financial situation, or needs of the individual recipient. RJFI and RJA do not hold an Australian financial services license. RJFI is exempt from the requirement to hold an Australian financial services license under the Corporations Act 2001 (Cth) in respect of financial services provided to Australian wholesale clients under the exemption in ASIC Class Order 03/1099 (as continued by ASIC Corporations (Repeal and Transitional) Instrument 2016/396 and extended by ASIC Corporations (Amendment) Instrument 2022/623). RJFI is regulated by the UK FCA under UK laws, which differ from Australian laws. RJA is acting on behalf of RJFI with respect to distribution and communications related to this report. For clients in New Zealand: This report contains general information only, it does not take into account your financial situation, needs, goals or risk tolerance and does not constitute financial advice under the Financial Markets Conduct Act 2013 (NZ) (“FMCA”). In New Zealand, it is intended for “wholesale clients” only (for the purposes of the FMCA) and it is not to be disseminated to retail clients or reproduced in any form. This report and the information contained in or accompanying this report: (i) are not, and are under no circumstances to be construed as, an offer of financial products for issue requiring disclosure to an investor under Part 3 of the FMCA; (ii) have not been registered, filed with or approved by any New Zealand regulatory authority or under or in accordance with the FMCA; and (iii) are not a disclosure document under New Zealand law and do not contain all the information that a disclosure document is required to contain under New Zealand law. For recipients in Taiwan: This report is being distributed to you from outside of Taiwan, and such distribution has not been licensed or approved by the regulators of Taiwan. This report is only available in Taiwan to persons who are “professional investors” (as that term is defined in the Rules Governing Securities Firms Engaging in Brokerage of Foreign Securities) and is supplied solely for the use of such professional investors. No person to whom a copy of this report is provided may issue, circulate or distribute this report in Taiwan, or make, give or show a copy of this report to any other person. For clients in Québec: Each client confirms its express wish that this document and all other contracts and related documents be drafted in the English language. Chaque client confirme sa volonté expresse que ce document ainsi que tous les autres contrats et documents s’y rattachant soient rédigés en langue anglaise. Additional SBI Client Disclaimers The content of this report (including the views and opinions expressed therein, and the information comprised therein) has been prepared for and is distributed by SBI, pursuant to an arrangement between RJA and SBI. RJA is not an affiliate of SBI. SBI is registered in Japan with the Financial Services Agency (“FSA”) as a Financial Instruments Business Operator (kinyu shouhin torihiki gyousha, a “FIBO”) registered with the FSA (Registration Number: Director of the Kanto Local Finance Bureau (Financial Instruments Business) No. 44) to engage in the Type I Financial Instruments Business (dai 1-shu kinyu shouhinn torihiki gyou), the Type II Financial Instruments Business (dai 2-shu kinyu shouhin torihiki gyou), the Investment Advisory Business and Investment Agency Business (toushi jogen gyou / toushi dairi gyou), and the Securities Related Business (yukashouken kanren gyou). This report is only for distribution by SBI in Japan to qualified institutional investors (tekikaku kikan toushika, “QIIs”) for whom exist certain disclosure and other obligations under the Financial Instruments and Exchange Act (“FIEA”). Any QIIs wishing to purchase, deal or otherwise discus the securities covered in this report should contact your sales representative. References to or commentary on the futures markets contained in this report are provided only in the context of their impact on securities traded with SBI or its partners or third-party service providers, including RJA for U.S. securities. No facility for trading futures has been provided to you and accordingly the information is not provided in connection with a dealing in futures. This report is not directed to, or intended for distribution to or use by, any person or entity who is a citizen or resident of or located in any locality, state, country or other jurisdiction where such distribution, publication, availability or use would be contrary to law or regulation. If your status has changed or the distribution restrictions set forth above impact your ability to receive this report, please contact your usual SBI representative. By accepting this report, the recipient hereof represents and warrants that he is entitled to receive such report in accordance with the restrictions set forth above and agrees to be bound by the limitations contained herein. Any failure to comply with these limitations may constitute a violation of law and limit our ability to provide reports to you. This report is being supplied to you strictly on the basis that it will remain confidential. No part of this report may be (i) copied, photocopied, duplicated, stored or reproduced in any form by any means or (ii) redistributed or passed on, directly or indirectly, to any other person in whole or in part, for any purpose without the prior written consent of SBI. The information contained in this report is prepared from data believed to be correct and reliable at the time of issue of this report. Under the terms of the agreement between RJA and SBI, RJA is not required to issue regular reports on the subject matter of this report at any frequency and it may cease to do so or change the periodicity of reports at any time. Neither RJA nor SBI is under any obligation to update this report in the event of a material change to the information contained in this report. Neither RJA nor SBI has any and will accept any, obligation to (i) check or ensure that the contents of this report remain current, reliable or relevant, (ii) ensure that the content of this report constitutes all the information a prospective investor may require, (iii) ensure the adequacy, accuracy, completeness, reliability or fairness of any views, opinions and information, and accordingly, SBI, its affiliates and related persons (and their respective directors, associates, connected persons and/or employees) shall not be liable in any manner whatsoever for any consequences (including but not limited to any direct, indirect or consequential losses, loss of profits and damages) of any reliance thereon or usage thereof. Unless otherwise specified, this report is based upon reasonable sources. Such sources will, unless otherwise specified, for market data, be market data and prices available from the main stock exchange or market where the relevant security is listed, or, where appropriate, any other market. Information on the accounts and business of company(ies) will generally be based on published statements of the company(ies), information disseminated by regulatory information services, other publicly available information. Whilst every effort is made to ensure that statements of facts made in this report are accurate, all estimates, projections, forecasts, expressions of opinion and other subjective judgments contained in this report are based on assumptions considered to be reasonable as of the date of the document in which they are contained and must not be construed as a representation that the matters referred to therein will occur. Past performance is not a reliable indicator of future performance. The value of investments may go down as well as up and those investing may, depending on the investments in question, lose more than the initial investment. No report shall constitute an offer or an invitation by or on behalf of SBI or RJA, or their respective affiliates to any person to buy or sell any investments. SBI and/or its respective affiliates and related corporations, their respective directors, associates, connected parties and/or employees may own or have positions in securities of the company(ies) covered in this report or any securities related thereto and may from time to time add to or dispose of, or may be materially interested in, any such securities. Further, SBI, its affiliates and its related corporations do and seek to do business with the company(ies) covered in this report and may from time to time act as market maker or have assumed an underwriting commitment in securities of such company(ies), may sell them to or buy them from customers on a principal basis and may also perform or seek to perform significant investment banking, advisory, underwriting or placement services for or relating to such company(ies) as well as solicit such investment, advisory or other services from any entity mentioned in this report. Any of RJA’s material conflicts of interest are disclosed above these Additional SBI Client Disclaimers, particularly in the sections titled “Analyst Information,” “Company Specific Disclosures,” and “Investor Disclosures.” By RJA producing this report for SBI, RJA has confirmed to SBI that the opinions expressed are based on information it believes to be accurate and complete and obtained through reliable public or other non-confidential sources at the time made. The term “RJA” shall, unless the context otherwise requires, mean RJA and its affiliates, subsidiaries and related companies. The term “SBI” shall denote, where appropriate, the relevant entity distributing or disseminating the report in the particular jurisdiction referenced below, or, in every other case except as otherwise stated herein, SBI Securities Co., Ltd. and its affiliates, subsidiaries and related corporations. Proprietary Rights Notice By accepting a copy of this report, you acknowledge and agree as follows: This report is confidential and is provided to clients of Raymond James only for your personal, noncommercial use. Except as expressly authorized by Raymond James, you may not copy, reproduce, transmit, sell, display, distribute, publish, broadcast, circulate, modify, disseminate, or commercially exploit the information contained in this report, in printed, electronic, or any other form, in any manner, without the prior express written consent of Raymond James. You also agree not to reproduce or otherwise to use this report or its contents, or to permit such use by others, (i) for any unlawful purpose; (ii) in or to create any derivative work; (iii) in any software program, including any artificial intelligence, augmented reality, or virtual reality platform or system; or (iv) for training artificial intelligence technologies, including without limitation technologies that are capable of generating works in the same style or genre as this report; provided, however, with regards to (ii), (iii), or (iv) above, unless and only to the extent as may be otherwise expressly agreed to in writing by Raymond James. This report and its contents are the property of Raymond James and are protected by applicable copyright, trade secret or other intellectual property laws (of the United States and other countries). United States law, 17 U.S.C. Sec. 501 et. seq., provides for civil and criminal penalties for copyright infringement. No copyright claimed in incorporated U.S. government works. © 2025 Raymond James Financial, Inc. All rights reserved. © 2025 Raymond James & Associates, Inc. © 2025 Raymond James Ltd., Member Canadian Investor Protection Fund

( Companies Mentioned: ABRA:TSX; ABBRF:OTCQX,
)
Source: Streetwise Reports 05/05/2025
StrikePoint Gold Inc.’s (SKP:TSX.V; STKXF:OTCQB) Nevada drilling revealed impressive near-surface gold zones with strong grades and heap leach potential. Read more for key assay highlights.
StrikePoint Gold Inc. (SKP:TSX.V; STKXF:OTCQB) has released final assay results from its Spring 2025 drilling campaign at the Hercules Gold Project, located in Nevada’s Walker Lane district. The company completed seven reverse circulation drill holes totaling approximately 1,400 meters, all of which intersected near-surface gold mineralization. Highlights include hole H25005, which cut 117.35 meters grading 0.45 grams per tonne (g/t) gold and 3.55 g/t silver, including 12.19 meters at 2.17 g/t gold and 9.55 g/t silver. Hole H25006 intercepted 10.67 meters of 1.17 g/t gold and 18.13 g/t silver starting at surface, alongside an additional 44.20 meters at 0.35 g/t gold and 4.34 g/t silver.
Company President and CEO Michael G. Allen stated in the news release, “This drill program successfully demonstrated that the Hercules Gold Project has a predictable, large, epithermal footprint hosting abundant near-surface oxide gold. Our geological model for the project has been confirmed, and we believe that the mineralization at Hercules shows the grade and consistency to move forward with the project.”
The Hercules Project, acquired in August 2024 for US$250,000, covers approximately 100 square kilometers and contains an Exploration Target, as defined by NI 43-101 standards, of 40.3 to 65.6 million tonnes grading 0.48 to 0.63 g/t gold. The site has historical data from over 306 drill holes and 121 surface trenches. Notably, cyanide solubility tests on the recent drill samples showed soluble gold ranges between 32% and 89% per hole, underscoring the potential for heap leach extraction methods.
Located roughly an hour from Reno, Nevada, a region that has produced more than 218 million ounces of gold historically, the Hercules site sits among globally recognized mining operations such as Barrick/Newmont’s Nevada Gold Mines, Kinross, SSR Mining, and McEwen Mining.
Shifting Economic Winds Shape the Gold Sector’s Landscape
According to a May 2 report from FX Street, gold prices gained positive momentum and moved away from a two-week low as the U.S. Dollar weakened slightly. This movement came ahead of the U.S. Nonfarm Payrolls (NFP) report, with traders increasingly betting on aggressive Federal Reserve policy easing. FX Street noted that the U.S. Dollar had initially climbed to a three-week high on optimism over possible U.S.-China trade negotiations but later turned cautious after U.S. economic data showed unexpected contraction. Traders anticipated that the Federal Reserve could deliver as many as four quarter-point rate reductions by year-end, following signs of easing inflation reflected in the Personal Consumption Expenditures (PCE) Price Index. FX Street reported, “The U.S. ADP report on private-sector employment suggested that the U.S. labor market is cooling,” adding that the increase in initial jobless claims to 241,000, the highest since February, contributed to the cautious tone. As a result, investors looked to gold as a safe-haven asset amid growing uncertainty in the broader economic outlook.
Stockhead’s Barry FitzGerald wrote, also on May 2, that record gold prices, notably more than AU$5,000 per ounce in Australia, created a rare window of opportunity for junior explorers to bring small brownfield gold projects into production. FitzGerald explained that such market conditions allowed companies to pursue cash flow generation and reinvest in exploration to expand resources. He quoted Javelin Minerals’ executive chairman Brett Mitchell, who emphasized that with established mineralized systems, “it is not a question of finding more gold at the projects, it is how much can be found and at what grade.” FitzGerald highlighted that rising gold prices provided juniors the chance to achieve market capitalizations several times over by capitalizing on existing indicated resources.
Ahead of the Herd reported on May 4 that the U.S. economy faced growing stagflation risks, defined as simultaneous high inflation and slowing economic growth. The report cited economist Stephen Roach, who wrote that the reversal of global trade efficiencies, alongside President Trump’s tariff policies, threatened to drive the U.S. into a prolonged period of stagflation. Historical data showed that stagflationary periods were favorable to gold, with the report noting, “Gold outperforms other asset classes during times of economic stagnation and higher prices.”
According to Ahead of the Herd, during the stagflationary 1970s, gold surged from US$100 per ounce in 1976 to approximately US$650 in 1980, as CPI inflation reached 14%. The report referenced Forbes data showing that gold returned 32.2% during stagflationary periods, outperforming U.S. Treasury bonds and equities.
Expert Assessments Highlight Positive Outlook for StrikePoint Gold
*According to Technical Analyst Clive Maund in an April 21 assessment, StrikePoint Gold Inc. was rated an “Immediate Strong Buy” due to its improving technical condition and its strong positioning within Nevada’s Walker Lane trend. Maund highlighted that “downside for the stock is very limited, whilst upside is relatively unlimited after its long bear market from its early 2021 highs, when it was almost 20 times the current price.”
He pointed to StrikePoint’s progress, noting that the company had advanced its goals with key acquisitions, including 152 claims at the Cuprite property and the Hercules Gold Project, both in Nevada, purchased at favorable prices. Maund emphasized that the company’s recent NI 43-101 technical report outlined an exploration target for Hercules ranging between 819,000 and 1,018,000 ounces of gold within 40.3 million to 65.6 million tonnes of mineralized material at an estimated grade range between 0.48 and 0.63 grams per tonne, marking a major step forward.
According to Technical Analyst Clive Maund in an April 21 assessment, StrikePoint Gold Inc. was rated an “Immediate Strong Buy” due to its improving technical condition and its strong positioning within Nevada’s Walker Lane trend.
Maund’s analysis underscored that StrikePoint’s share structure remained reasonable, with 41.6 million shares outstanding, and noted that significant holdings by investors such as Eric Sprott and Pathfinder Asset Management strengthened its profile. He explained that there had been “a marked buildup in upside volume since mid-February that has driven the Accumulation line quite steeply higher,” indicating that knowledgeable investors had been accumulating shares in anticipation of a potential breakout. Maund set his first target for an advance at CA$0.40, followed by CA$0.90 and then CA$1.20, supported by technical chart patterns and volume trends.
In a post from Jeff Clark of The Gold Advisor on May 1, StrikePoint Gold reported promising assay results from the first four of seven drill holes completed at its Hercules Gold Project in Nevada.
Clark noted that the 100-square-kilometer Walker Lane project hosted multiple previously drilled low-sulphidation epithermal gold targets. He highlighted that results from the 1,400-meter reverse circulation program included 32.0 meters grading 0.54 grams per tonne (g/t) gold and 4.62 g/t silver, with intervals such as 4.6 meters at 1.14 g/t gold and 10.5 g/t silver, and 6.1 meters at 1.5 g/t gold and 11.8 g/t silver.
While Clark acknowledged that these were not high-grade intercepts, he emphasized that the widths suggested potential for open-pit mining scenarios. He stated that StrikePoint remained a pre-discovery story and added, “We’ll keep StrikePoint on Hold until we see what management can do to advance the story at Hercules in the latter half of 2025,” signaling that further progress could shift investor attention.
Upcoming Drivers: Advancing Hercules and Cuprite Exploration
StrikePoint’s investor presentation emphasizes the company’s unique positioning with one of the five largest land packages in Nevada’s Walker Lane, an area near the significant AngloGold Ashanti “Expanded Silicon” discovery. CEO Michael Allen, known for advancing the Sterling Project prior to its sale to Coeur Mining and later to AngloGold Ashanti for US$150 million, leads the company’s strategy. The Hercules Project benefits from over 300 prior drill holes, multiple drill-ready targets, and 45 untested geophysical zones, some containing visible gold. Current permits, including a Plan of Operations and two Notice Level exploration permits, allow StrikePoint flexibility to expand large-scale drilling. [OWNERSHIP_CHART-209]
The conceptual Exploration Target ranges between 819,000 to 1,018,000 ounces of gold at grades between 0.48 and 0.63 g/t, all open for expansion. Additionally, StrikePoint holds the Cuprite Gold Project, which features geological similarities to the Expanded Silicon discovery and has delivered reportable gold-silver mineralization in four of its first five holes. With a cash position of approximately CA$1.95 million as of December 31, 2024, and a market capitalization of roughly CA$5.0 million, StrikePoint is focusing on advancing its Nevada projects alongside its British Columbia assets. Management sees Nevada’s combination of infrastructure access, historical production, and underexplored districts as key to potential shareholder value.
Ownership and Share Structure
According to Refinitiv, Executive Chairman Shawn Khunkhun owns 0.28% of the company, President and CEO Allen owns 1%, Director Ian Richard Harris owns 0.07%, and Director Adrian Wallace Fleming owns 0.02%.
Refinitiv reported that institutional and strategic investors own approximately 13.47% of the company, including 2176423 Ontario Ltd. with 7.17%, and Pathfinder Asset Management Ltd. with 4.81%.
According to Refinitiv, the company has 41.59 million shares outstanding and a market cap of CA$6.24 million. It trades in a 52-week range of CA$0.12 and CA$0.85. Sign up for our FREE newsletter at: www.streetwisereports.com/get-news
Important Disclosures:
- StrikePoint Gold Inc. is a billboard sponsor of Streetwise Reports and pays SWR a monthly sponsorship fee between US$4,000 and US$5,000.
- As of the date of this article, officers and/or employees of Streetwise Reports LLC (including members of their household) own securities of StrikePoint Gold Inc.
- James Guttman wrote this article for Streetwise Reports LLC and provides services to Streetwise Reports as an employee.
- This article does not constitute investment advice and is not a solicitation for any investment. Streetwise Reports does not render general or specific investment advice and the information on Streetwise Reports should not be considered a recommendation to buy or sell any security. Each reader is encouraged to consult with his or her personal financial adviser and perform their own comprehensive investment research. By opening this page, each reader accepts and agrees to Streetwise Reports’ terms of use and full legal disclaimer.
- Streetwise Reports does not endorse or recommend the business, products, services or securities of any company.
For additional disclosures, please click here.
* Disclosure for the quote from the Clive Maund article published on April 21, 2025
- For the quoted article (published on April 21, 2025), the Company has paid Street Smart, an affiliate of Streetwise Reports, US$1,500.
- Author Certification and Compensation: [Clive Maund of clivemaund.com] is being compensated as an independent contractor by Street Smart, an affiliate of Streetwise Reports, for writing the article quoted. Maund received his UK Technical Analysts’ Diploma in 1989. The recommendations and opinions expressed in the article accurately reflect the personal, independent, and objective views of the author regarding any and all of the designated securities discussed. No part of the compensation received by the author was, is, or will be directly or indirectly related to the specific recommendations or views expressed
Clivemaund.com Disclosures
The quoted article represents the opinion and analysis of Mr. Maund, based on data available to him, at the time of writing. Mr. Maund’s opinions are his own, and are not a recommendation or an offer to buy or sell securities. As trading and investing in any financial markets may involve serious risk of loss, Mr. Maund recommends that you consult with a qualified investment advisor, one licensed by appropriate regulatory agencies in your legal jurisdiction and do your own due diligence and research when making any kind of a transaction with financial ramifications. Although a qualified and experienced stock market analyst, Clive Maund is not a Registered Securities Advisor. Therefore Mr. Maund’s opinions on the market and stocks cannot be only be construed as a recommendation or solicitation to buy and sell securities.

( Companies Mentioned: SKP:TSX.V; STKXF:OTCQB,
)
Source: Eric Winmill 05/05/2025
AbraSilver Resource Corp. (ABRA:TSX; ABBRF:OTCQX) will include these data in its upcoming mineral resource estimate on its project in Argentina expected mid-year, noted a Scotiabank report.
AbraSilver Resource Corp.’s (ABRA:TSX; ABBRF:OTCQX) final drill results from its phase four program, targeting the JAC Extension, at its Diablillos silver-gold project showed additional multiple high-grade, near-surface silver intercepts beyond the conceptual open pit, reported Scotiabank Analyst Eric Winmill in an April 29 research note.
“We view this news as positive for AbraSilver shares as we see potential for resource expansion based on drill success to date in areas located near planned mining areas and infrastructure,” Winmill wrote.
85% Return Potential
The Canadian explorer was trading at the time of the report at about CA$2.98 per share, “below gold development peers at 0.41x and silver producers trading at 0.82x,” noted Winmill.
In comparison, Scotiabank’s target price on AbraSilver is CA$5.50 per share. This reflects a potential return for investors of 85%.
The company remains rated Outperform.
It has 169 million (169M) outstanding shares and 129M free float traded shares. Its market cap is CA$504 million.
High Grades Near Surface
These last reported results from the phase four, 21,172 meter (21,172m) exploration program were from the JAC Extension and returned high-grade, near surface mineralization, reported Winmill.
Some of the highlight intercepts were:
- 56m of 107.4 grams per ton gold (107.4 g/t Au) from 66m downhole (DDH-25-001)
- 63m of 138.6 g/t Au from 74m downhole, including 26m of 243.7 g/t Au from 100m downhole (DDH-25-005)
- 41.5m of 159.8 g/t Au from 56m downhole, including 7m of 398.5 g/t Au from 86m downhole (DDH-25-012)
The Next Step
AbraSilver plans to incorporate these data into an updated mineral resource estimate, due to be completed in mid-2025.
Sign up for our FREE newsletter at: www.streetwisereports.com/get-news
Important Disclosures:
- AbraSilver Resource Corp. is a billboard sponsor of Streetwise Reports and pays SWR a monthly sponsorship fee between US$4,000 and US$5,000.
- Doresa Banning wrote this article for Streetwise Reports LLC and provides services to Streetwise Reports as an independent contractor.
- This article does not constitute investment advice and is not a solicitation for any investment. Streetwise Reports does not render general or specific investment advice and the information on Streetwise Reports should not be considered a recommendation to buy or sell any security. Each reader is encouraged to consult with his or her personal financial adviser and perform their own comprehensive investment research. By opening this page, each reader accepts and agrees to Streetwise Reports’ terms of use and full legal disclaimer. Streetwise Reports does not endorse or recommend the business, products, services or securities of any company.
For additional disclosures, please click here.
Disclosures for Scotiabank, AbraSilver Resource Corp., April 29, 2025
Company Disclosures (see legend below)* AbraSilver Resources Corp. G, I, J, N1, N3, U, VS0911 I, Eric Winmill, certify that (1) the views expressed in this report in connection with securities or issuers that I analyze accurately reflect my personal views and (2) no part of my compensation was, is, or will be directly or indirectly, related to the specific recommendations or views expressed by me in this report. Analysts employed by non-U.S. affiliates are not registered/qualified as research analysts with FINRA in the U.S. unless otherwise noted within this report. These analysts may not be associated persons of Scotia Capital (USA) Inc. and therefore may not be subject to the FINRA Rule 2241 restrictions on communications with a subject company, public appearances and trading securities held by a research analyst account. This document has been prepared by Research Analysts employed by The Bank of Nova Scotia and/or its affiliates. The Bank of Nova Scotia, its subsidiaries, branches and affiliates are referred to herein as “Scotiabank.” “Scotiabank” together with “Global Banking and Markets” is the marketing name of the global corporate and investment banking and capital markets business of The Bank of Nova Scotia and its affiliates. Scotiabank, Global Banking and Markets produces research reports under a single marketing identity referred to as “globally branded research” under U.S. rules. This research is produced on a single global research platform with one set of rules which meet the most stringent standards set by regulators in the various jurisdictions in which the research reports are produced. In addition, the Research Analysts who produce the research reports, regardless of location, are subject to one set of policies designed to meet the most stringent rules established by regulators in the various jurisdictions where the research reports are produced. Scotiabank relies on information barriers to control the flow of non-public or proprietary information contained in one or more areas within Scotiabank into other areas, units, groups or affiliates of Scotiabank. In addition, Scotiabank has implemented procedures to prevent research independence being compromised by any interactions they may have with other business areas of The Bank of Nova Scotia. The compensation of the Research Analyst who prepared this document is determined exclusively by Scotiabank Research Management and senior management (not including investment or corporate banking). Research Analyst compensation is not based on investment or corporate banking revenues; however, compensation may relate to the revenues of Scotiabank as a whole, of which investment banking, corporate banking, sales and trading are a part. Scotiabank Research will initiate, update and cease coverage solely at the discretion of Scotiabank Research Management. Scotiabank Research has independent supervisory oversight and does not report to the corporate or investment banking functions of Scotiabank. For Scotiabank, Global Banking and Markets Research Analyst Standards and Disclosure Policies, please visit www.gbm.scotiabank.com/ disclosures. For additional questions, please contact Scotiabank, Global Banking and Markets Research, 4 King St W, 12th Flr, Toronto, Ontario, M5H 1A1. Time of dissemination: April 29, 2025, 10:58 ET. Time of production: April 29, 2025, 10:56 ET. Note: Time of dissemination is defined as the time at which the document was disseminated to clients. Time of production is defined as the time at which the Supervisory Analyst approved the document. *Legend G Scotia Capital Inc., Scotia Capital (USA) Inc., or their affiliates have managed or co-managed a public offering of securities for this issuer in the past 12 months. I Scotia Capital Inc., Scotia Capital (USA) Inc., or their affiliates have received compensation for investment banking services from this issuer in the past 12 months. J Scotia Capital Inc., Scotia Capital (USA) Inc., or their affiliates expects to receive or intends to seek compensation for investment banking services from this issuer in the next 3 months. N1 Scotia Capital Inc., Scotia Capital (USA) Inc., or their affiliates have had an investment banking services client relationship with this issuer during the past 12 months. N3 Scotia Capital Inc., Scotia Capital (USA) Inc., or their affiliates have had a non-securities services client relationship with this issuer during the past 12 months. U Within the last 12 months, Scotia Capital Inc. and/or its affiliates have undertaken an underwriting liability with respect to equity or debt securities of, or have provided advice for a fee with respect to, this issuer. VS0911 Research Analyst Eric Winmill visited Abra Silver’s Diablillos mine, an exploration-stage silver-gold project in Argentina on April 10 and 11, 2025. The issuer paid for a portion of the travel-related expenses incurred by the Research Analyst to visit the site.
Definition of Scotiabank, Global Banking and Markets Equity Research Ratings Scotiabank has a three-tiered rating system, with ratings of Sector Outperform, Sector Perform, and Sector Underperform. Each Research Analyst assigns a rating that is relative to his or her coverage universe or an index identified by the Research Analyst that includes, but is not limited to, stocks covered by the Research Analyst. The rating assigned to each security covered in this report is based on the Scotiabank, Global Banking and Markets Research Analyst’s 12- month view on the security. Research Analysts may sometimes express in research reports shorter-term views on these securities that may impact the price of the equity security in a manner directly counter to the Research Analyst’s 12-month view. These shorter-term views are based upon catalysts or events that may have a shorter-term impact on the market price of the equity securities discussed in research reports, including but not limited to the inherent volatility of the marketplace. Any such shorter-term views expressed in research report are distinct from and do not affect the Research Analyst’s 12-month view and are clearly noted as such. Ratings Sector Outperform (SO) The stock is expected to outperform the average 12-month total return of the analyst’s coverage universe or an index identified by the analyst that includes, but is not limited to, stocks covered by the analyst. Sector Perform (SP) The stock is expected to perform approximately in line with the average 12-month total return of the analyst’s coverage universe or an index identified by the analyst that includes, but is not limited to, stocks covered by the analyst. Sector Underperform (SU) The stock is expected to underperform the average 12-month total return of the analyst’s coverage universe or an index identified by the analyst that includes, but is not limited to, stocks covered by the analyst. Other Ratings Under Review – The rating has been temporarily placed under review, until sufficient information has been received and assessed by the analyst. Risk Ranking The Speculative risk ranking reflects exceptionally high financial and/or operational risk, exceptionally low predictability of financial results, and exceptionally high stock volatility. The Director of Research and the Supervisory Analyst jointly make the final determination of the Speculative risk ranking.
Ratings Distribution As of March 31, 2025 Companies Rated in Each Category Investment Banking Service Provided in the Last 12 Months Rating Count Percentage Count Percentage Sector Outperform 328 53% 128 39% Sector Perform 277 44% 107 39% Sector Underperform 19 3% 4 21% For the purposes of the ratings distribution disclosure FINRA requires members who use a ratings system with terms different than “buy,” “hold/neutral” and “sell,” to equate their own ratings into these categories. Our Sector Outperform, Sector Perform, and Sector Underperform ratings are based on the criteria above, but for this purpose could be equated to buy, neutral and sell ratings, respectively.
General Disclosures This document is for distribution only as may be permitted by law. It is not directed to, or intended for distribution to or use by, any person or entity who is a citizen or resident of or located in any locality, state, country or other jurisdiction where such distribution, publication, availability or use would be contrary to law or regulation or would subject Scotiabank to any registration or licensing requirement within such jurisdiction. It is published solely for information purposes; it is not an advertisement nor is it a solicitation or an offer to buy or sell any financial instruments or to participate in any particular trading strategy. No representation or warranty, either express or implied, is provided in relation to the accuracy, completeness or reliability of the information contained in this document except with respect to information concerning Bank of Nova Scotia (TSX: BNS; NYSE: BNS). This document is not intended to be a complete statement or summary of the securities, markets or developments referred to in this document. Scotiabank does not undertake to update or keep current the information contained herein, nor make any commitment as to the frequency of publication. If you are affected by EU MiFID or the onshored UK MiFID regime, you must advise us in writing at trade_supervision@scotiabank.com. Any opinions expressed in this document may change without notice and may differ or be contrary to opinions expressed by other business areas or groups of Scotiabank. Any statements contained in this document attributed to a third party represent Scotiabank’s interpretation of the data, information and/or opinions (“Information”) provided by that third party either publicly or through a subscription service, and such use and interpretation have not been reviewed by the third party. Any statements made in this document based on Information are, to the best of the knowledge of the party making those statements, accurate at the time they are made, provided that Scotiabank makes no representation to any party regarding such accuracy or completeness. Nothing in this document constitutes a representation that any investment strategy or recommendation is suitable or appropriate to an investor’s individual circumstances or otherwise constitutes a personal recommendation. Investments involve risks, and investors should exercise prudence and their own independent judgement in making their investment decisions and carefully consider any risks involved. The financial instruments that may be described in this document may not be eligible for sale in all jurisdictions or to certain categories of investors. Instruments such as options, derivative products, and futures are not suitable for all investors, and trading in these instruments is considered risky. Mortgage and asset-backed securities may involve a high degree of risk and may be highly volatile in response to fluctuations in interest rates or other market conditions. Foreign currency rates of exchange may adversely affect the value, price, or income of any security or related instrument referred to in this document. For investment advice, trade execution, or other enquiries, clients should contact their local sales representative. The value of any investment or income may go down as well as up, and investors may not get back the full amount invested. Past performance is not necessarily a guide to future performance. To the full extent permitted by law, neither Scotiabank nor any of its directors, employees or agents accepts any liability whatsoever for any direct or consequential loss arising from any use of the information or this document. Nothing in this document constitutes financial, investment, tax, accounting or legal advice. Investors should seek their own legal, financial and tax advice regarding the appropriateness of investing in any securities or pursuing any strategies discussed in the document. Any prices stated in this document are for information purposes only and do not represent real-time valuations for individual securities or other financial instruments. There is no representation that any transaction can or could have been effected at those prices, and any prices do not necessarily reflect Scotiabank’s internal books and records or theoretical model-based valuations and may be based on certain assumptions. Different assumptions by Scotiabank or any other source may yield substantially different results. All pricing of securities in reports is based on the closing price of the securities’ principal marketplace on the night before the publication date, unless otherwise explicitly stated. The Research Analyst(s) responsible for the preparation of this document may interact with trading desk personnel, sales personnel and other parties for the purpose of gathering, applying and interpreting market information. In the normal course of offering investment and banking products and services to clients, Scotiabank may act in several capacities (including issuer, market maker, underwriter, distributor, index sponsor, swap counterparty, and calculation agent) simultaneously with respect to a product, giving rise to conflicts of interest. Scotiabank uses controls such as information barriers to manage conflicts should they arise. Scotiabank and its affiliates, officers, directors, and employees may have long or short positions (including hedging and trading positions), trade as principal and buy and sell in instruments or derivatives identified herein; such transactions or positions may be inconsistent with the opinions expressed in this document. Recipients of this document should expect that Scotiabank will from time to time perform services (including investment banking or capital market services) in connection with the services and activities described in this document and that they perform services for and engage in transactions with other market participants, including the issuers of certain of the investments underlying the transactions herein. Cedar Leaf Capital, an affiliate of Scotia Capital Inc., operates as a registered Investment Dealer across all provinces and territories in Canada and is regulated by the Canadian Investment Regulatory Organization (CIRO). Cedar Leaf Capital is majority-owned by three Indigenous shareholders, Nch’ḵay̓ Development Limited Partnership, Des Nedhe Financial LP and Chippewas of Rama First Nation, and is controlled by Scotiabank. The information in this document has been prepared without taking into account any investor’s objectives, financial situation or needs, and investors should, before acting on the information, conduct independent due diligence when making an investment decision and consider the appropriateness of the information, having regard to their objectives, financial situation and needs. For further information, please contact your sales representative. Scotiabank specifically prohibits the redistribution of this document in whole or in part without Scotiabank’s prior written permission, and Scotiabank accepts no liability whatsoever for the actions of third parties in this respect. Images may depict objects or elements that are protected by third-party copyright, trademarks and other intellectual property rights. Equity research reports published by Scotiabank are initially and simultaneously made available electronically to intended recipients through its proprietary research website, ScotiaView, e-mail, and through third-party aggregators. The mediums in which research is disseminated to clients may vary depending on client preference as to the frequency and manner of receiving research reports. Institutional clients with questions regarding distribution of equity research or who wish to access the proprietary model used to produce this report should contact Scotiabank at 1-800-208-7666. A list of all investment recommendations in an equity security or issuer that have been disseminated during the preceding 12 months is available at the following location: www.gbm.scotiabank.com/disclosures. Additional Disclosures Australia: This report is provided in Australia by the Bank of Nova Scotia, an APRA-regulated Authorised Deposit-Taking Institution (Foreign Bank ADI) holding an Australian Financial Services Licence (AFSL). Canada: Distributed to eligible Canadian persons by Scotia Capital Inc., a registered investment dealer in Canada. Chile: This report is distributed by Scotia Corredora de Bolsa Chile Limitada, a subsidiary of The Bank of Nova Scotia, in compliance with the General Standard Norms Num. 504 (NCG 504) issued by the Commission for the Financial Market (CMF) of Chile. China: The research report may not be offered, sold or delivered, or offered or sold or delivered to any person for reoffering or resale or redelivery, in any such case directly or indirectly, in Mainland China (excluding Hong Kong, Macau and Taiwan, “China”) in contravention of any applicable laws. This research report does not constitute an offer to sell or the solicitation of an offer to buy any securities in Mainland China (excluding Hong Kong, Macau and Taiwan, “China”) to any person to whom it is unlawful to make the offer or solicitation in China. The issuer does not represent that this research report may be lawfully distributed, or that any securities may be lawfully offered, in compliance with any applicable registration or other requirements in Mainland China (excluding Hong Kong, Macau and Taiwan, “China”), or pursuant to an exemption available thereunder, or assume any responsibility for facilitating any such distribution or offering. In particular, no action has been taken by the issuer which would permit a public offering of any securities or distribution of this document in China. Accordingly, the securities are not being offered or sold within China by means of this research report or any other document. Neither this research report nor any advertisement or other offering material may be distributed or published in China, except under circumstances that will result in compliance with any applicable laws and regulations. Colombia: This report is distributed in Colombia by The Bank of Nova Scotia (“Scotiabank”) or Scotia Capital Inc. (“SCI”) through the Representation in Scotiabank Colpatria S.A. and/or Scotia Securities (Colombia) S.A. Sociedad Comisionista de Bolsa authorized by the Financial Superintendence of Colombia via Resolutions 1377 of 2010, 058 of 2014, 226 of 2015 and 1070 of 2021 and 1080 of 2022. This document does not contain any type of investment advice nor does it aim to provide advice. This report is prepared by analysts employed by Scotiabank and certain of its affiliates, including SCI. This report is strictly private and confidential and may not be reproduced or used for any other purpose by the recipient of this report or provided to any person or entity other than the recipient of this report. Hong Kong: This report is distributed by The Bank of Nova Scotia Hong Kong Branch, which is authorized by the Securities and Futures Commission to conduct Type 1 and Type 4 regulated activities and regulated by the Hong Kong Monetary Authority. Japan: This research report is provided for information purposes only and it is not intended to solicit any orders for securities transactions or commodities futures contracts. While we believe that the data and information contained in this research report are obtained from reliable sources, we do not guarantee the accuracy or completeness of the data and information. Mexico: The information contained in this report is for informational purposes only and is not intended to influence the decision of the addressee in any way whatsoever with respect to an investment in a certain type of security, financial instrument, commodity, futures contract, issuer, or market, and is not to be construed as an offer to sell or a solicitation of an offer to buy any securities or commodities futures contracts. Scotia Inverlat Casa de Bolsa, S.A. de C.V., Grupo Financiero Scotiabank Inverlat, is not responsible for the outcome of any investment performed based on the contents of this research report. The analysis contained in this research report reflects exclusively the point of view of the Analysts responsible for its preparation. The Analysts did not receive any compensation other than from the Financial Entity or Investment Advisor to which they provide their services or from legal entities that belong to the same Financial Group or Business Group.
Peru: This report is distributed by Scotiabank Peru SAA, a subsidiary of The Bank of Nova Scotia. This report is prepared by analysts employed by The Bank of Nova Scotia and certain of its affiliates, including Scotia Capital Inc. Singapore: For investors in the Republic of Singapore, this document is provided via an arrangement with The Bank of Nova Scotia, Singapore Branch, pursuant to Regulation 32C of the Financial Advisers Regulations. The material contained in this document is intended solely for accredited, expert or institutional investors, as defined under the Securities and Futures Act 2001. If there are any matters arising from, or in connection with this material, please contact The Bank of Nova Scotia, Singapore Branch, located at 1 Raffles Quay, #20-01 North Tower, One Raffles Quay, Singapore 048583, telephone: +65 6305 8388. South Korea: This advice has been provided to certain qualified professional investors provided under Article 7, Paragraph 4, Subparagraph 7 of the Enforcement Decree of the Financial Investment Services and Capital Markets Act of Korea without solicitation or advertisement to such investors. The information contained in this advice should not be construed as offer, marketing or solicitation of any financial investment products. This document is intended for general circulation only and any recommendation that may be contained in this document concerning an investment product does not take into account the specific investment objectives, financial situation, or particular needs of any particular person, and advice should be sought from a financial adviser based in Singapore regarding the suitability of the investment product, taking into account the specific investment objectives, financial situation, or particular needs of any person in receipt of the recommendation, before the person makes a commitment to purchase the investment product. The Bank of Nova Scotia, Singapore Branch, and/or its affiliates may have in the past done business with or may currently be doing or seeking to do business with the companies or issuers covered in this report. The information provided or to be provided or actions taken by or to be taken by The Bank of Nova Scotia, Singapore Branch, and/or its affiliates in such circumstances may be different from or contrary to the discussion set out in this report. United Kingdom and the rest of Europe: Except as otherwise specified herein, this material is distributed by The Bank of Nova Scotia, London branch (“BNS London”), or Scotiabank (Ireland) Designated Activity Company to persons who are eligible counterparties or professional clients. BNS London is authorised by the Prudential Regulation Authority (PRA) and subject to regulation by the Financial Conduct Authority (FCA) and limited regulation by the PRA. Scotiabank (Ireland) Designated Activity Company is authorised and regulated by the Central Bank of Ireland (CBI). United States: United States: Distributed to U.S. persons by Scotia Capital (USA) Inc. or by an authorized subsidiary or affiliate of The Bank of Nova Scotia that is not registered as a U.S. broker-dealer (a ‘non-U.S. affiliate’) to Major US Institutional Investors only. Scotia Capital (USA) Inc. accepts responsibility for the content of a document prepared by its non-U.S. affiliate (s) when distributed to U.S. persons by Scotia Capital (USA) Inc. To the extent that a U.S. person wishes to transact in the securities mentioned in this document through Scotiabank, such transactions must be effected through Scotia Capital (USA) Inc., and not through a non-U.S. affiliate. The information in this document has not been approved, disapproved, or recommended by the U.S. Securities and Exchange Commission (“SEC”), any state securities commission in the United States or any other U.S. or non-U.S. regulatory authority. None of these authorities has passed on or endorsed the merits or the accuracy or adequacy of this document. Any representation to the contrary is a criminal offense in the United States. ™ Trademark of The Bank of Nova Scotia. Used under license, where applicable. Scotiabank, together with “Global Banking and Markets,” is a marketing name for the global corporate and investment banking and capital markets businesses of The Bank of Nova Scotia and certain of its affiliates in the countries where they operate, including Scotia Capital Inc., Scotia Capital (USA) Inc., Scotiabank Europe plc, Scotiabank (Ireland) Designated Activity Company, Scotiabank Inverlat S.A., Institución de Banca Múltiple, Grupo Financiero Scotiabank Inverlat, Scotia Inverlat Casa de Bolsa S.A. de C.V., Grupo Financiero Scotiabank Inverlat, Scotia Inverlat Derivados S.A. de C.V. – all members of the Scotiabank Group and authorized users of the mark. The Bank of Nova Scotia is incorporated in Canada with limited liability. Scotia Capital Inc. is a member of the Canadian Investor Protection Fund and regulated by the Investment Industry Regulatory Organization of Canada. Scotia Capital (USA) Inc. is a broker-dealer registered with the SEC and is a member of FINRA, NYSE, NFA and SIPC. BNS London is authorised by the Prudential Regulation Authority (“PRA”) and subject to regulation by the Financial Conduct Authority (“FCA”) and limited regulation by the PRA. Scotiabank Europe plc is authorised by the PRA and subject to regulation by the FCA and PRA. Scotiabank (Ireland) Designated Activity Company is authorised and regulated by the CBI. Scotiabank Inverlat, S.A., Institución de Banca Múltiple, Grupo Financiero Scotiabank Inverlat , Scotia Inverlat Casa de Bolsa, S.A. de C.V., Grupo Financiero Scotiabank Inverlat, and Scotia Inverlat Derivados, S.A. de C.V., are each authorized and regulated by the Mexican financial authorities. © The Bank of Nova Scotia 2025 This report and all the information, opinions, and conclusions contained in it are protected by copyright. This report may not be reproduced in whole or in part, or referred to in any manner whatsoever, nor may the information, opinions, and conclusions contained in it be referred to without the prior, express consent of Scotiabank, Global Banking and Markets. The Bank of Nova Scotia, Scotiabank, and Global Banking and Markets logo and names are among the registered and unregistered trademarks of The Bank of Nova Scotia. All rights reserved.

( Companies Mentioned: ABRA:TSX; ABBRF:OTCQX,
)
- Peru suspends gold mining in north after massacre dw.com
- 13 Workers Found Killed at Gold Mine in Peru The New York Times
- Gold mining suspended in Peru’s north after 13 miners killed The Guardian
- Peru kidnapping leaves 13 dead in gold mine BBC
- 13 security guards kidnapped from a Peruvian gold mine found dead CBS News
- Mining Murders Show Peru’s Struggles With an Illegal Gold Rush Bloomberg.com
- Bodies of 13 workers kidnapped from a Peruvian gold mine are found Financial Times
- Thirteen killed in Peru mine kidnapping amid rising violence Mining.com
- Kidnappers kill 13 guards at Peru mine The Northern Miner
Peru suspends gold mining in north after massacre MSN
Gold prices rise: Portfolio mgr. outlines 3 gold mining stocks Yahoo Finance
SEC Form 6-K filed by Harmony Gold Mining Company Limited Quantisnow