A historical milestone: Gold futures closes above $3,350 KITCO
Category: Gold
Gold zooms past $3,300/oz as investors seek shelter from tariff war Reuters
Categories
Gold Explorer Has Massive Breakout Potential
Source: Clive Maund 04/15/2025
Technical Analyst Clive Maund reviews the factors that, in his opinion, make Dryden Gold Corp. (DRY:TSXV; DRYGF:OTCQB) a very Immediate Strong Buy.
Dryden Gold Corp. (DRY:TSXV; DRYGF:OTCQB) is a gold exploration company whose time has come. The company is advancing a gold-rich extensive district-scale project in Ontario, Canada, and has already made significant discoveries.
The reason that the company’s time has come is a combination of the progress that it has made on its property with the ongoing powerful bull market in gold, which is increasingly drawing attention to companies like Dryden. As we will proceed to see when we examine the latest stock chart for Dryden, the stock has been under persistent accumulation for a long time and is right now on the point of breaking out of its large base pattern into a major bull market.
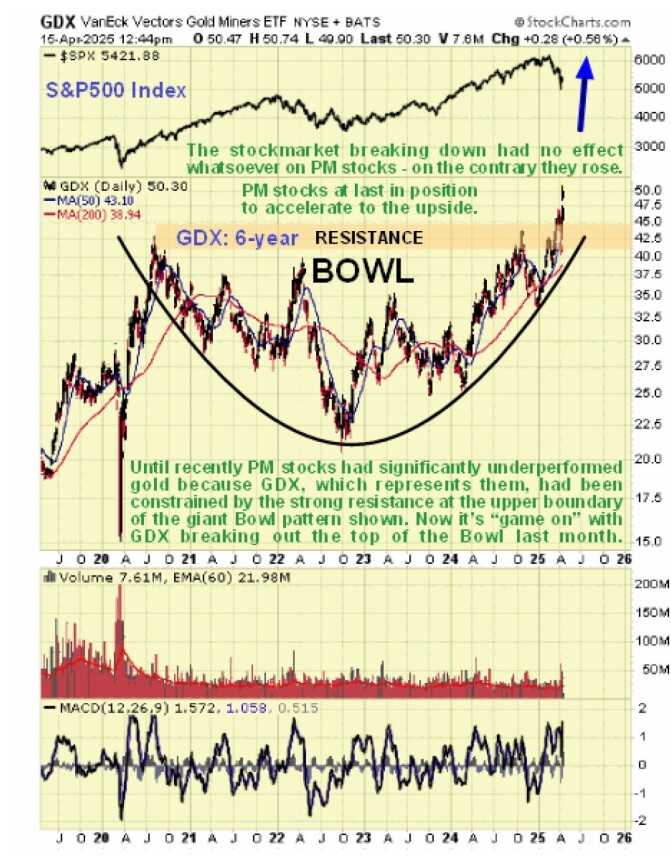
First, I wanted to touch on the precious metals sector. With gold leading the way, the precious metals sector staged a spectacular breakout from a 5-year-long Bowl consolidation pattern just last week. This Bowl pattern is evident on the charts for GDX, the HUI index, and the large stock XAU index. It is shown on the 6-year chart for GDX below.

This broad sector breakout is believed to mark the start of a major growth phase for gold and silver stocks, which means that stocks like Dryden Gold will “have the wind at their back” as they will be given added impetus by a strongly rising sector.
Before looking at the stock chart, we will overview the fundamentals of the company using pages from its latest investor deck, which is new out this month.
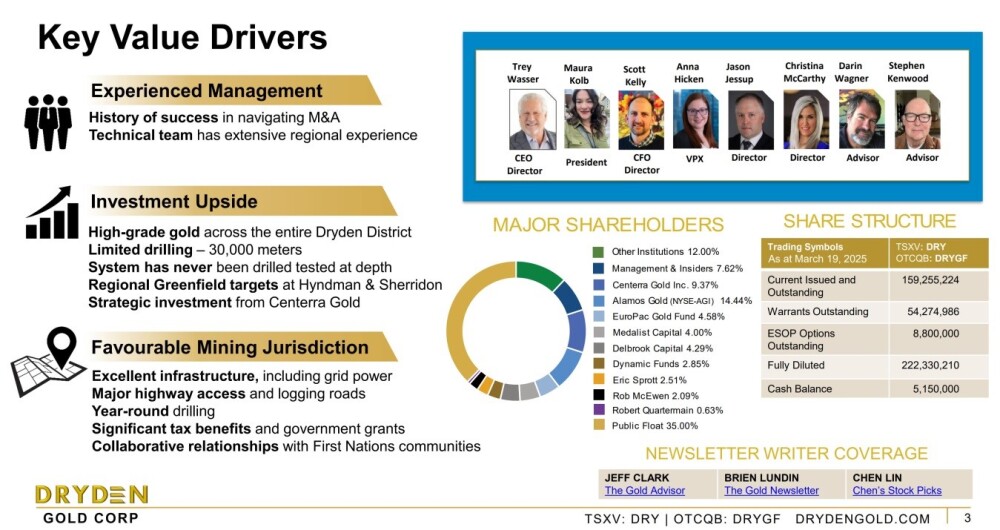
This page from the deck provides a quick overview of the company. Amongst the many key points presented on this page, a very important one to note is that, while the number of shares in issue may be considered high at 159 million, only 35% of these are in the public float due to sizable percentages being owned by management and insiders, funds and institutions and it is also noteworthy that legendary precious-metals-sector investors Eric Sprott and Rob McEwen have significant stakes.
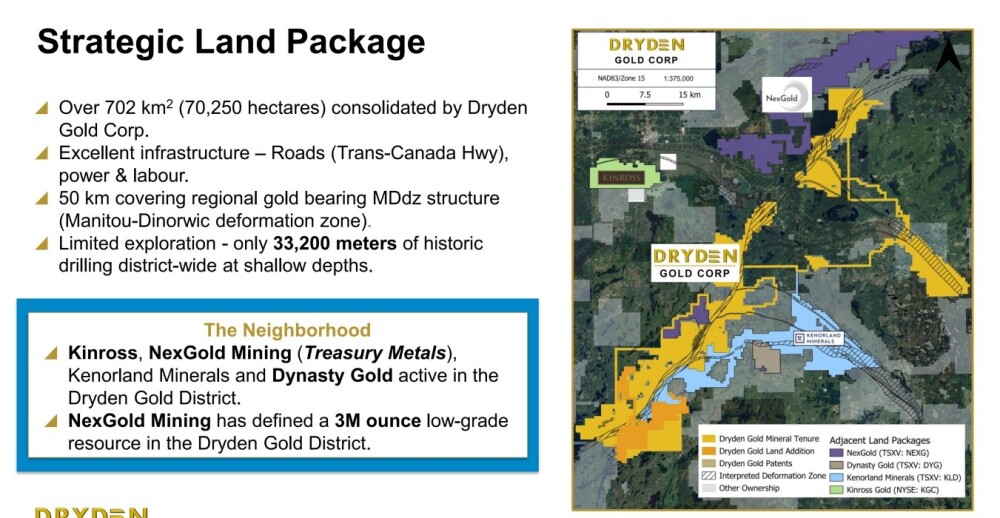
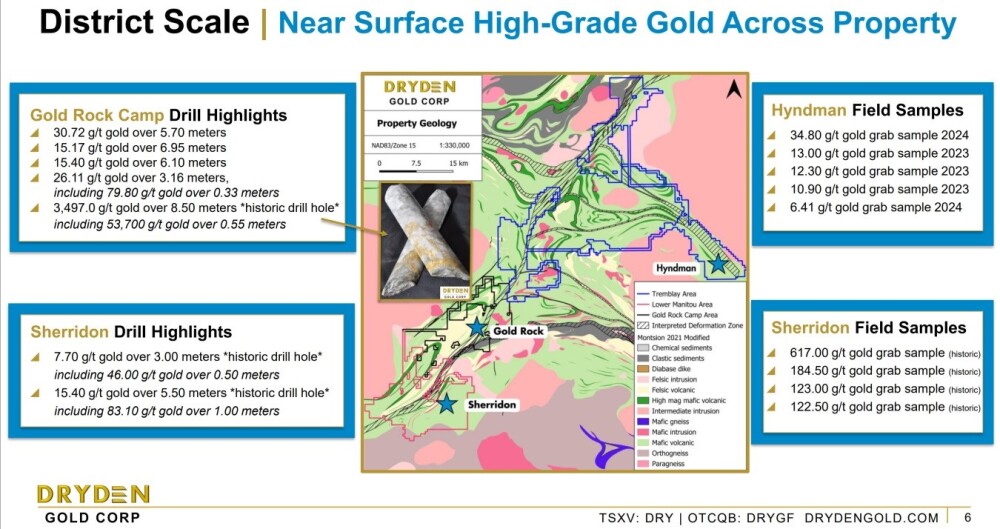
The next page shows the physical location of the Dryden Gold property in Ontario and its proximity to other big projects in the area owned by prominent mining companies, which certainly augurs well for further significant discoveries on the company’s extensive property.
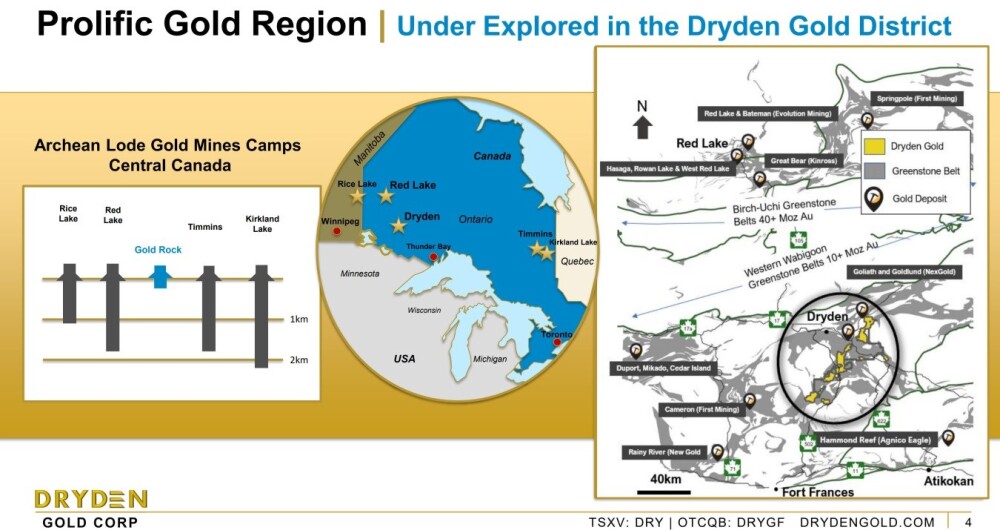
Dryden’s land package is massive, and the fact that it is surrounded by other large properties being developed by other major mining companies with Dynasty Gold Corporation (DYG:TSX.V), Kenorland Minerals Ltd. (KLD:TSX.V; KLDCF:OTCMKTS; 3WQO:FSE),Kinross Gold Corp. (K:TSX; KGC:NYSE), and NexGold Mining Corp. (NEXG.V:TSXV; NXGCF:OTCQX; TRC1.F:FRA) nearby is certainly auspicious.
Near-surface high-grade gold has already been found across the property, meaning that the potential is great — district scale, in fact.
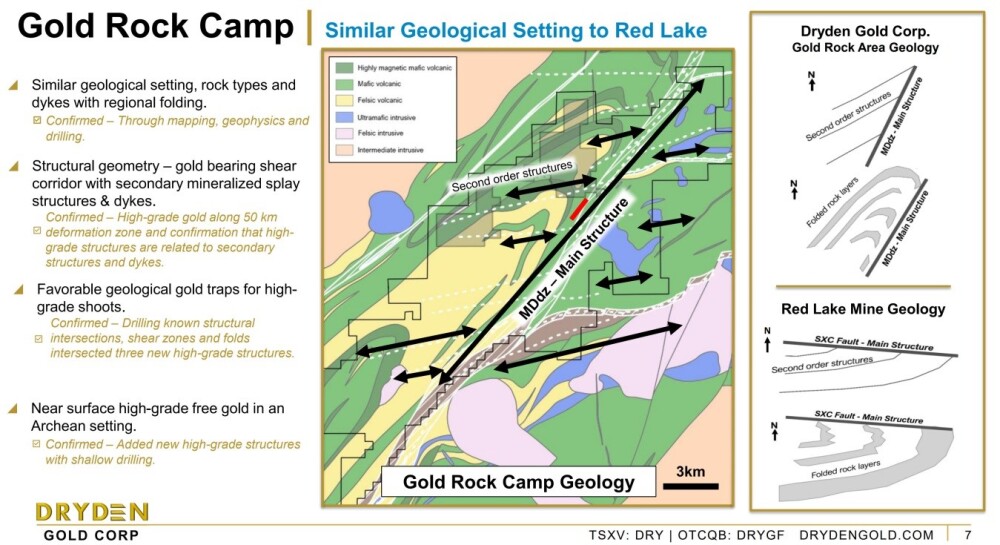
The Gold Rock Camp has similar geology to Red Lake — and most people in the industry know about that.
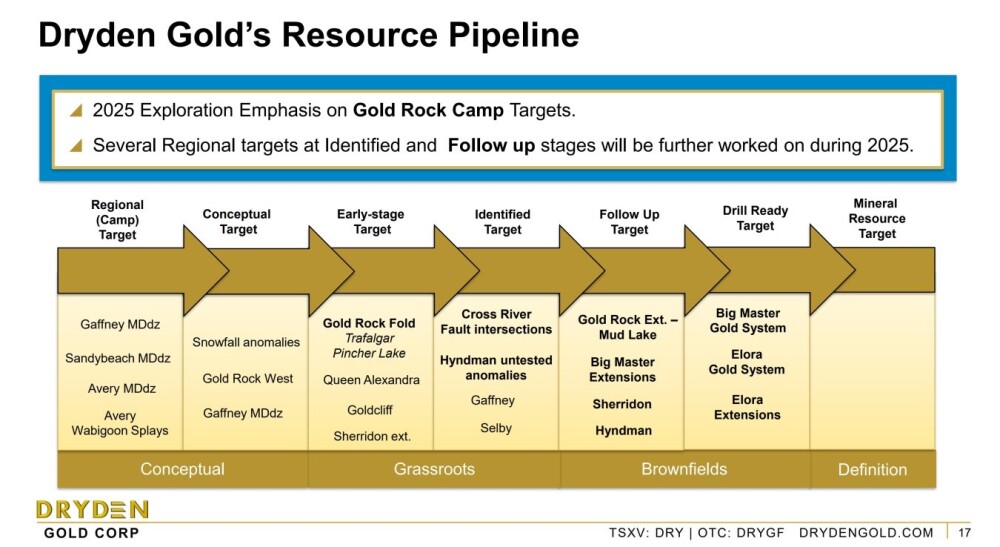
The following chart shows the progress of exploration, and as we can see, several big targets are now drill-ready.
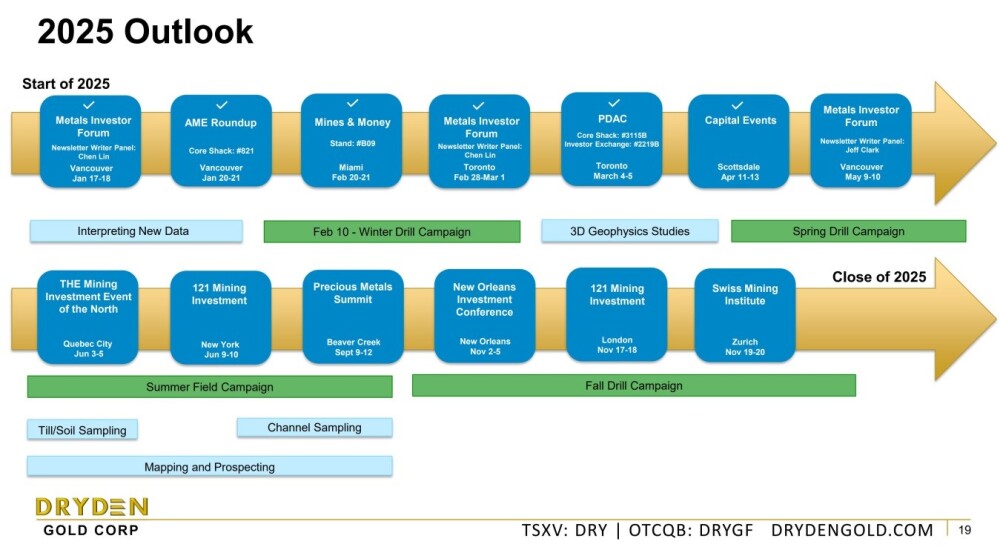
This page shows the 2025 outlook with a Spring drill campaign underway and a Fall drill campaign in prospect.
Now we will examine the stock chart for Dryden Gold. Only one is necessary because it started trading on this market in January of last year so we are looking at a 16-month chart which shows all of the action in the stock.
The first point to make is that, aware of the potential of this company and the prospect of a major ongoing gold bull market, Dryden Gold has already been recommended on a couple of occasions, once last May at CA$0.10 and again in September at CA$0.13. The second point to make is that, with Dryden Gold starting to break out into its expected bull market right now, the commitment and patience of investors accumulating the stock within its large base pattern is about to be rewarded BIG TIME.
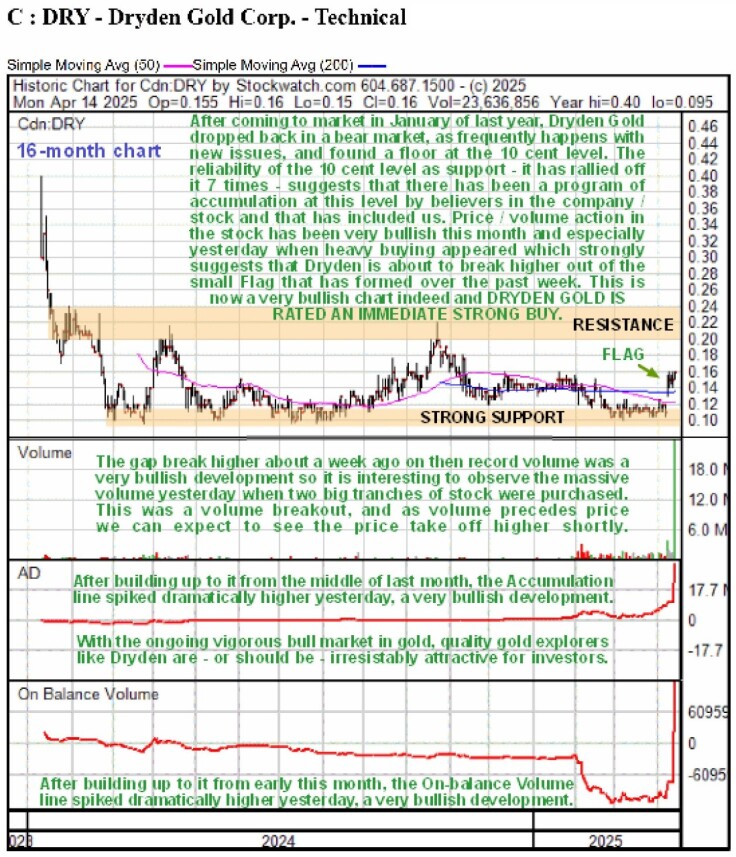
After coming to market in January of last year, the price dropped steeply until it found a floor of support at the CA$0.10 level. Thereafter, it has tracked sideways in a large trading range bounded by CA$0.10 or a little under on the downside and CA$0.22 at most on the upside. The reliability of the 10 cent level as support, which the price has rallied off no less than seven times, suggests that there has been a program of accumulation at this level by believers in the company and its stock.
Given the relentless upward march of the gold price, it was only a matter of time before more savvy investors put two and two together and, understanding the potential of Dryden, accumulated more and more of the stock ahead of its breakout into a new bull market. Last month and this month this accumulation has become much more overt and aggressive with the gap higher on record volume, at the time, about a week ago, signaling that it was “game on” and that the long awaited bull market was about to start.
Thus, it is most interesting to observe how the price edged higher yesterday on massive record volume, with two huge blocks of stock being bought. Since “volume precedes price” this means that “the writing is on the wall” and Dryden looks destined to take off higher imminently in a powerful bull market that is expected to be long and sustained, especially as the company makes more discoveries on its large District Scale property.
We therefore stay long and Dryden Gold is rated an Immediate Very Strong Buy. The first target for an advance is the resistance at CA$0.22 – CA$0.24, with a higher target once this is cleared at CA$0.40 and higher targets are possible.
Dryden Gold Corp.’s website.
Dryden Gold Corp. (DRY:TSXV; DRYGF:OTCQB) closed for trading at CA$0.16, US$0.1188 on April 14, 2025.
Sign up for our FREE newsletter at: www.streetwisereports.com/get-news
Important Disclosures:
- Dryden Gold Corp. is a billboard sponsor of Streetwise Reports and pays SWR a monthly sponsorship fee between US$4,000 and US$5,000.
-
For this article, the Company has paid Street Smart, an affiliate of Streetwise Reports, US$1,500.
- As of the date of this article, officers and/or employees of Streetwise Reports LLC (including members of their household) own securities of Dryden Gold Corp.
- Author Certification and Compensation: [Clive Maund of clivemaund.com] was retained and compensated as an independent contractor by Street Smart to write this article. Mr. Maund is a technical analyst who analyzes historical trading data and he received his UK Technical Analysts’ Diploma in 1989. The recommendations and opinions expressed in this content reflect the personal, independent, and objective views of the author regarding any and all of the companies discussed. No part of the compensation received by the author was, is, or will be directly or indirectly tied to the specific recommendations or views expressed.
- Statements and opinions expressed are the opinions of the author and not of Streetwise Reports, Street Smart, or their officers. The author is wholly responsible for the accuracy of the statements. Streetwise Reports requires contributing authors to disclose any shareholdings in, or economic relationships with, companies that they write about. Any disclosures from the author can be found below. Streetwise Reports relies upon the authors to accurately provide this information and Streetwise Reports has no means of verifying its accuracy.
- This article does not constitute investment advice and is not a solicitation for any investment. Streetwise Reports does not render general or specific investment advice and the information on Streetwise Reports should not be considered a recommendation to buy or sell any security. Each reader is encouraged to consult with his or her personal financial adviser and perform their own comprehensive investment research. By opening this page, each reader accepts and agrees to Streetwise Reports’ terms of use and full legal disclaimer. Streetwise Reports does not endorse or recommend the business, products, services, or securities of any company.
For additional disclosures, please click here.
Clivemaund.com Disclosures
The above represents the opinion and analysis of Mr. Maund, based on data available to him, at the time of writing. Mr. Maund’s opinions are his own, and are not a recommendation or an offer to buy or sell securities. As trading and investing in any financial markets may involve serious risk of loss, Mr. Maund recommends that you consult with a qualified investment advisor, one licensed by appropriate regulatory agencies in your legal jurisdiction, and do your own due diligence and research when making any kind of a transaction with financial ramifications. Although a qualified and experienced stock market analyst, Clive Maund is not a Registered Securities Advisor. Therefore Mr. Maund’s opinions on the market and stocks cannot be construed as a recommendation or solicitation to buy and sell securities.

( Companies Mentioned: DRY:TSXV; DRYGF:OTCQB,
)
Categories
Gold Royalty Deal Expands Yukon Potential
Source: Streetwise Reports 04/15/2025
Metallic Minerals Corp. (MMG:TSX.V; MMNGF:OTCQB) has signed a deal for a second operation in Yukons Klondike Goldfields, unlocking potential near-term returns. Read more inside.
Metallic Minerals Corp. (MMG:TSX.V; MMNGF:OTCQB) has signed a new production royalty agreement covering an additional mile of alluvial gold claims at its Australia Creek property in the Klondike Gold District of Yukon Territory. This agreement, announced on April 15, expands the company’s leased royalty ground to over two miles and builds on its existing royalty portfolio following initial production in 2023 and 2024. The new lease is with a seasoned Yukon mining operator who brings more than 40 years of experience, and production is expected to begin during the 2025 mining season.
Under the terms of the deal, the operator is required to meet a minimum annual work commitment of CA$500,000 and pay a 12 percent royalty on all gold produced to Metallic Minerals. The company anticipates at least two gold mining operations to be active on its royalty claims in 2025, with ongoing discussions for additional agreements underway. “With gold prices at historic highs, we’ve seen strong interest in our alluvial gold royalty portfolio,” said Greg Johnson, Chairman and CEO of Metallic Minerals, in a company news release. “This agreement supports a second operation capitalizing on today’s market conditions with an operator that has a track record of operational excellence and environmental stewardship.”
Metallic Minerals holds a 100 percent interest in 36.4 square kilometers of mining rights along Australia Creek, considered a significant eastern extension of the historic Klondike Gold District. The area is recognized by the Yukon Geological Survey as part of the productive Klondike Goldfields, which have historically yielded over 20 million ounces of gold. While Australia Creek itself was not historically mined due to its role as a water source for dredging operations, modern exploration has returned gold-in-gravel values comparable to some of the best-producing areas nearby.
The company reported that site preparation is already underway, including camp setup and road clearing. Funds generated through Australia Creek royalties are expected to support exploration activities at the company’s other hard rock projects in Yukon and Colorado.
Gold Demand Builds Amid Economic Volatility
Gold remained the focal point of investor interest as macroeconomic volatility and policy uncertainty continued to drive capital toward safe-haven assets. According to a report published on April 11 by UBS, gold reached a record closing high of US$3,200 per ounce, prompting the bank’s Chief Investment Office to raise its base case forecast to US$3,500 per ounce. The team cited “a perfect storm of factors like escalating geopolitical tensions, fears of inflation, and a shifting interest rate outlook” as key contributors to the surge in demand.
UBS added that these price gains were not only being fueled by safe-haven buying but also by a structural shift in asset allocations, with “central banks systematically raising gold’s share of total reserves.” The bank forecasted central bank gold purchases would reach 1,000 metric tons in 2025, an increase from its previous estimate of 950 metric tons. ETF flows were also expected to reverse a multi-year trend of net selling, with UBS increasing its projection for net buying in 2025 from 300 to 450 metric tons.
In a separate analysis from April 12, Shad Marquitz of Excelsior Prosperity emphasized that gold stood apart from traditional safe havens during a turbulent week in financial markets. “It was gold alone that really separated from the rest of the markets and the rest of the traditional safe havens to be the shining light and refuge from the volatility and market chop,” he wrote. Marquitz highlighted that while bonds and the U.S. dollar sold off amid tariff-related disruptions, gold reached new all-time daily and weekly highs. He noted the gold equities’ resilience as well, pointing out that “GDX closed the week up at US$49.70 . . . definitively higher than the 2020 peak.”
On April 13, Dominic Frisby of The Flying Frisby also underscored gold’s shifting role in global finance, stating that gold was “your hedge against government,” especially in an environment where U.S. authorities have used the dollar and treasuries as tools in trade conflicts. He pointed to surging demand from central banks, referencing analyst Jan Nieuwenhuijs’s report that China purchased 570 tonnes of gold in 2024 alone. Frisby noted that gold has become increasingly favored as a neutral asset amid financial uncertainty and forecasted that its share of international reserves could rise from the current 20 percent to 40 percent over the next five years.
Finally, in an April 14 sector update, analyst Adrian Day wrote that commodities, and particularly gold, had the strongest risk-reward profile in the current environment of stagflation concerns and policy instability. “The drivers for gold demand are still intact,” Day stated, adding that government deficits, dollar weaponization, and geopolitical stressors continued to support the metal. He argued that “gold will continue to shine,” citing its historical tendency to outperform during periods of economic volatility and market rotation.
Positive Outlook Supports Recent Share Gains
According to a March 26 report from Peter Krauth of Silver Stock Investor, Metallic Minerals Corp. appeared to be gaining momentum as investor recognition increased.
Krauth stated that “Metallic Minerals Corp. shares are up about 50% year to date, aided by metals prices and value recognition.” He also noted that the company’s shares “look undervalued and attractive to add on minor weakness,” highlighting the potential for continued upside based on current valuation and sector trends.
Advancing a Multi-Asset Royalty and Discovery Model
Metallic Minerals continues to position itself as a hybrid royalty generator and explorer, with the Australia Creek development adding near-term cash flow potential. The company’s April 2025 corporate presentation highlights several key catalysts ahead. On the royalty side, alluvial gold production continues into 2024 and is projected to expand in 2025, with ten or more potential mining operations eventually active within its Yukon claims. Additional ground remains available for lease in both Australia Creek and Granite Creek.
Meanwhile, the company is advancing its La Plata Project in Colorado and Keno Silver Project in Yukon. Newmont Corp. holds a 9.5 percent strategic stake in Metallic Minerals focused on the advancement of the La Plata Project, which has an inferred resource of 1.21 billion pounds of copper and 17.6 million ounces of silver. A resource update is expected in the second quarter of 2025, following a drilling campaign partially funded by Newmont. The Keno Silver Project hosts an inaugural inferred resource of 18.2 million silver-equivalent ounces, announced in February 2024, and remains open to significant expansion. [OWNERSHIP_CHART-9081]
As the company continues to generate revenue through its growing royalty portfolio, it is also leveraging advanced technology such as AI-powered geophysical analysis and USGS-supported regional mapping to accelerate its hard rock exploration. The dual focus on cash flow generation and exploration growth provides multiple near- and mid-term inflection points for Metallic Minerals across its portfolio.
Ownership and Share Structure
About 17% of Metallic Minerals is owned by management and insiders, including CEO Greg Johnson with 4%, Independent Director Gregor Hamilton with 0.93%, and the president, Scott Petsel, with 0.48%.
About 34% is owned by strategic investors, including Newmont’s 9.5% and mining financier Eric Sprott, who owns 14.5%.
About 22% is owned institutionally. The rest, 27%, is retail.
Its market cap is CA$39.43 million, with 178.91 million shares outstanding and 130.31 million free-floating. It trades in a 52-week range of CA$0.40 and CA$0.13. Sign up for our FREE newsletter at: www.streetwisereports.com/get-news
Important Disclosures:
- Metallic Minerals Corp. is a billboard sponsor of Streetwise Reports and pays SWR a monthly sponsorship fee between US$4,000 and US$5,000.
- James Guttman wrote this article for Streetwise Reports LLC and provides services to Streetwise Reports as an employee.
- This article does not constitute investment advice and is not a solicitation for any investment. Streetwise Reports does not render general or specific investment advice and the information on Streetwise Reports should not be considered a recommendation to buy or sell any security. Each reader is encouraged to consult with his or her personal financial adviser and perform their own comprehensive investment research. By opening this page, each reader accepts and agrees to Streetwise Reports’ terms of use and full legal disclaimer. Streetwise Reports does not endorse or recommend the business, products, services or securities of any company.
For additional disclosures, please click here.

( Companies Mentioned: MMG:TSX.V; MMNGF:OTCQB,
)
Categories
An Actionable Idea

Source: Michael Ballanger 04/15/2025
Michael Ballanger of GGM Advisory Inc. shares current movements in his account.
In the GGMA 2025 Trading Account:
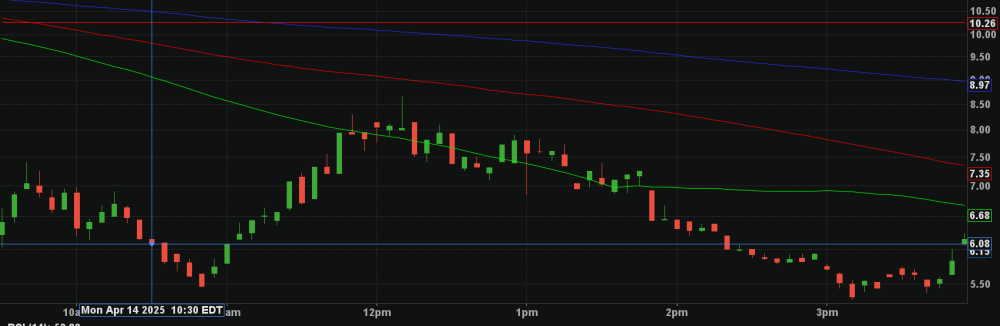
- Bought 25 contracts (25%) position in the SPY May $500 puts at $5.98.
After trading up to $8.66 by shortly after noon hour, they sank to a low of $5.30 before closing at $6.22.
I wrote “Do not chase” shortly after the noon hour, and the afternoon action gave everyone another chance at my $6.00 entry point until the markets sold off in the final 15 minutes.
In bear markets, one of the rules I learned in the 1981-1982 period was to always use the set-up for a long position that prohibits one from buying anything on an “UP” day.
In momentum markets, the likes of which investors have ridden since March 2009, buying dips and then adding into momentum spikes was an effective strategy.
In bear markets, it is the exact reverse. You sell rallies first and then cover the short into dips. With the primary trend down, your odds of winning increase and the losses are reduced by either poor entries or whipsaws by a wide margin.
As for the Actionable Idea, on the Tuesday opening:
- Add tranche #2 to the 25% position at $6.00
- Keep adding 25% for every dollar lower it goes.
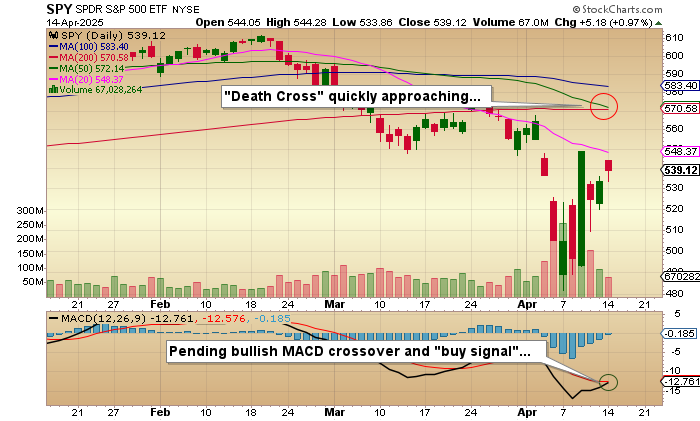
Watch very closely the descent of the 50-dma toward the flattening 200-dma, and despite what might be a bullish MACD crossover, I am betting that the “death cross” will negate the “buy signal” and trigger the move to re-test the lows around $481.80.
With the arrival of the ominous “DC,” I will immediately increase the position in the SPY May $500 puts and add VIX June $25 calls. For non-option players, you can use SQQQ:US and UVIX:US as suitable ETF replacements.
Juniors
In addition to the two big positions — Getchell Gold Corp. (GTCH:CSE; GGLDF:OTCQB) and Fitzroy Minerals Inc. (FTZ:TSX.V; FTZFF:OTCQB) — I own positions in a couple of junior explorers (that shall remain nameless that are down 63.33% and 47.67% respectively with neither generating any excitement whatsoever in recent drilling programs.
The sad performance of these companies is a graphic statement on the lack of interest that still pervades the sector. Despite $3,250 gold, $32.75 silver, and $4.65 copper — superb prices on a historical basis — speculators are still steering well-clear of the junior mining exploration space.
As I wrote about this morning, Getchell Gold Corp. is as ridiculously undervalued as was the market’s reaction to a truly world-class drill intercept in Fitzroy Minerals Inc.’s recent press release. The “tariff tantrum,” thrown by the global markets after “Liberation Day” that threatened to derail the global bond and currency markets, caused a great deal of panic but I honestly did not think for a New York nanosecond that these amateurs would sell FTZ/FTZFF down from CA$0.395 to CA$0.20 because of a minor 17% pullback in the S&P 500 which is up over 940% since the lows of March 2009.
Why sell an obvious winner and a fully-funded winner at that?
Nonetheless, I have some dead weight now, taking up valuable space in both the portfolio account and the trading account, and I intend to contact management about these underperforming issues to find out how management intends to solve the problem. And if I hear the words “difficult market” or “buyers are not to be found”, then I will toss these names violently overboard and add instead to my to “big dogs” (GTCH/GGLDF and FTZ/FTZFF) who are breaking their backs delivering value to shareholders despite pervasive investor apathy.
With markets now in full rotation mode, it is time to add to “what is working” and dump “what is not.”
(P.S. Every time I walk through the exercise of assessing Getchell Gold’s Fondaway Canyon project, I am more and more convinced that I should be paid more than I have for accurately predicting the gold and copper prices almost to the penny since I first launched in 2020. GTCH/GGLDF is about as cheap a stock as you will ever get for the value-per-ounce at which it is currently valued. I have consistently told the world that Fondaway would be an economically viable project since first acquired in 2019, and despite a doubling of the resource, a doubling of the gold price, and the delivery of a Preliminary Economic Assessment detailing a “robust” result and a 46.7% IRR over a 10.3-year Life of Mine, the stock sits at less than a third of its 2022 peak at CA$0.67. Drives me batty.)
Sign up for our FREE newsletter at: www.streetwisereports.com/get-news
Important Disclosures:
- As of the date of this article, officers and/or employees of Streetwise Reports LLC (including members of their household) own securities of Getchell Gold Corp. and Fitzroy Minerals Inc.
- Michael Ballanger: I, or members of my immediate household or family, own securities of: All. My company has a financial relationship with: All. I determined which companies would be included in this article based on my research and understanding of the sector.
- Statements and opinions expressed are the opinions of the author and not of Streetwise Reports, Street Smart, or their officers. The author is wholly responsible for the accuracy of the statements. Streetwise Reports was not paid by the author to publish or syndicate this article. Streetwise Reports requires contributing authors to disclose any shareholdings in, or economic relationships with, companies that they write about. Any disclosures from the author can be found below. Streetwise Reports relies upon the authors to accurately provide this information and Streetwise Reports has no means of verifying its accuracy.
- This article does not constitute investment advice and is not a solicitation for any investment. Streetwise Reports does not render general or specific investment advice and the information on Streetwise Reports should not be considered a recommendation to buy or sell any security. Each reader is encouraged to consult with his or her personal financial adviser and perform their own comprehensive investment research. By opening this page, each reader accepts and agrees to Streetwise Reports’ terms of use and full legal disclaimer. Streetwise Reports does not endorse or recommend the business, products, services or securities of any company.
For additional disclosures, please click here.
Michael Ballanger Disclosures
This letter makes no guarantee or warranty on the accuracy or completeness of the data provided. Nothing contained herein is intended or shall be deemed to be investment advice, implied or otherwise. This letter represents my views and replicates trades that I am making but nothing more than that. Always consult your registered advisor to assist you with your investments. I accept no liability for any loss arising from the use of the data contained on this letter. Options and junior mining stocks contain a high level of risk that may result in the loss of part or all invested capital and therefore are suitable for experienced and professional investors and traders only. One should be familiar with the risks involved in junior mining and options trading and we recommend consulting a financial adviser if you feel you do not understand the risks involved.

Categories
Explorer Hits 80 G/T Gold at Goliath West
Source: Streetwise Reports 04/15/2025
NexGold Mining Corp. (NEXG.V:TSXV; NXGCF:OTCQX; TRC1.F:FRA) intersected high-grade gold and silver at Goliath West and Far East in Ontario, extending mineralization up to 450 meters deep. Read more on how these findings may impact future resource updates and long-term development plans.
NexGold Mining Corp. (NEXG.V:TSXV; NXGCF:OTCQX; TRC1.F:FRA) announced additional drill results from its 25,000-meter diamond drill program at the Goliath Gold Complex in northwestern Ontario, revealing high-grade gold and silver intercepts at both the Goliath West and Far East areas. The Goliath Gold Complex includes the Goliath, Goldlund, and Miller deposits. This round of drilling included 3,759 meters at Goliath West and 2,328 meters at Far East.
At Goliath West, drill hole TL24-689 returned 10.25 grams per tonne (g/t) gold and 2.81 g/t silver over 4.78 meters, including a high-grade subinterval of 80.30 g/t gold and 13.60 g/t silver over 0.53 meters. Another notable intercept from TL25-692 showed 3.05 g/t gold and 2.06 g/t silver over 10.80 meters, including 29.30 g/t gold and 5.70 g/t silver over 0.75 meters. The drilling extended known mineralization down-dip and down-plunge below the current prefeasibility study (PFS) pit shell, with the deepest holes extending the mineralized envelope to approximately 450 meters below surface. According to the company, gold mineralization at Goliath West remains open at depth.
Drilling at Far East, located eight kilometers east of Goliath, intersected gold and silver mineralization immediately below previously defined zones. TL24-685 intersected 1.71 g/t gold and 11.47 g/t silver over 6.02 meters, including 9.82 g/t gold and 56.90 g/t silver over 0.50 meters. The new results extend the zone down-dip by 170 meters to a depth of approximately 300 meters. Mineralization remains open at depth and along strike.
“The high-grade gold mineralization at Goliath West represents potential extensions of the deposit below the planned open pit,” said Kevin Bullock, President and CEO of NexGold, in a company news release. He added that the proximity of the newly intersected mineralization to the proposed processing plant is “significant,” supporting future project longevity and mill feed.
The Far East drilling was supported by a US$200,000 grant from the Ontario Junior Exploration Program, which aids exploration in northern and Indigenous communities.
NexGold also disclosed a two-month corporate awareness agreement with Quantum Ventures Inc., valued at CA$175,000, to assist with media strategy and business outreach. The agreement is subject to TSX Venture Exchange approval.
Gold Sector Outlook Amid Market Turbulence and Shifting Macro Trends
Gold has continued to demonstrate strength as a safe-haven asset amid global macroeconomic and geopolitical uncertainty, with several analysts noting sustained demand and price momentum through April. According to Shad Marquitz in an April 11 commentary for Excelsior Prosperity, gold futures reached a new all-time closing high of US$3,254.90, with aftermarket trading pushing prices even higher. Marquitz observed that “it was gold alone that really separated from the rest of the markets and the rest of the traditional safe havens to be the shining light and refuge from the volatility and market chop.” Despite a sell-off in both the U.S. dollar and long-term bonds, gold prices rose, indicating a divergence from traditional inverse correlations. Marquitz added that global central banks continued to accumulate gold, reinforcing its status as a store of value even as bond yields and the U.S. dollar weakened.
Also on April 11, the UBS Editorial Team raised its base case gold price forecast to US$3,500 per ounce, citing a “perfect storm” of supporting factors, including heightened geopolitical tensions, persistent inflation fears, and a reconfigured interest rate outlook. The team identified a “structural shift in gold allocations,” driven in part by central banks systematically raising gold’s share of total reserves. UBS expected central bank gold purchases in 2025 to reach 1,000 metric tons and raised its estimate for ETF net buying to 450 metric tons.
In an April 13 article for The Flying Frisby, Dominic Frisby emphasized that the recent gold rally had been led primarily by institutional and central bank buying rather than retail demand. He pointed to China’s purchase of 570 tonnes of gold in 2024 and suggested that “every pullback has been bought” since the U.S. froze Russian sovereign assets. Frisby argued that gold had reclaimed its role as the true neutral reserve asset, writing, “Gold is your hedge against government . . . Inert gold . . . doesn’t care which side of the trade wars, the culture wars, or any other wars you’re on.”
Global Analyst Adrian Day, writing on April 14, placed gold’s performance in the context of broader market trends and macroeconomic risks. He highlighted that “gold . . . responds well to uncertainty, whether geopolitical, economic, or monetary” and identified it as the asset “most likely to do well” if the current environment of stagflation and market weakness continues. Day noted that the drivers of gold’s bull market — such as unsustainable government deficits and de-dollarization—remained intact, even as other asset classes faced valuation pressure or deteriorating fundamentals. He emphasized that gold’s long-term value proposition had not been diminished by the latest economic developments.
NexGold Targets Lower Costs and Smaller Footprint in Upcoming Feasibility Study
According to Jay Taylor of J Taylor’s Gold, Energy & Tech Stocks in a March 15 report, NexGold Mining Corp. was advancing work on its feasibility study (FS) with a focus on cost optimization and environmental refinement. Taylor noted that the FS, being prepared under NI 43-101 standards, remained on schedule for completion in the second quarter.
Company CEO Kevin Bullock stated that the planned optimizations incorporated feedback from community engagement efforts and aimed to reduce both initial and sustaining capital costs. Bullock explained that the modifications could “decrease the footprint of the Tailings Storage Facility (TSF) and overall project infrastructure,” with the potential for “an earlier closure of the TSF and Waste Rock Storage Facility,” lowering long-term operational and financial assurance obligations beginning in Year 4.
Taylor also reported that NexGold had collaborated with several engineering and environmental consultants—Ausenco, WSP, SLR Consulting Canada Ltd., Minnow Environmental Inc., RockEng, and SRK—over the past several months. These partnerships contributed to a refined project design that may enhance economic feasibility while maintaining a focus on environmental responsibility. The final FS was expected to further detail these improvements and clarify their role in shaping NexGold’s development approach.
What’s Next at Goliath and Goldboro
NexGold continues to advance development across its combined Goliath and Goldboro assets, which are among Canada’s most advanced near-permitted gold projects. The Goliath Gold Complex has received federal environmental assessment approval and is supported by a robust February 2023 prefeasibility study, which is outlined in the NexGold Investor Presentation. The study outlines a 13-year mine life with an average production of 100,000 gold ounces annually for the first nine years and an after-tax net present value (NPV5%) of C$336 million at a US$1,750/oz gold price.
The PFS projects gold recoveries of 92.8% using a 6,500 tonne-per-day gravity and carbon-in-leach processing plant. All-in-sustaining costs (AISC) were estimated at US$1,072 per ounce. At higher gold prices, the project demonstrates strong sensitivity, with a post-tax NPV5% increasing to CA$493 million at US$1,950/oz.
Meanwhile, the Goldboro project in Nova Scotia is backed by a 2021 feasibility study outlining a phased open pit and future underground operation. It carries an after-tax NPV5% of CA$328 million and a 25.5% internal rate of return (IRR) at a US$1,600/oz gold price. Goldboro’s high gold recovery rate of 95.8% and its fully lined tailings facility add to the project’s operational profile. [OWNERSHIP_CHART-1961]
The combined company, which includes the Goliath, Goldlund, Miller deposits as part of the Goliath Gold Complex, and Goldboro Gold Project, has over 4.7 million measured and indicated gold ounces and an additional 1.3 million inferred ounces across its properties. As of January 2025, NexGold held a pro forma cash balance of approximately US$25 million and a market capitalization of US$100.5 million.
Ongoing exploration and recent intercepts at Goliath West and Far East could contribute to future resource updates and project scale, supporting the company’s strategy to build a long-life mining operation in Ontario.
Ownership and Share Structure
The company notes management and insiders own 2.7% of NexGold.
Institutions own 22.5%.
Strategic investors own 35.7%. Frank Guistra owns 8.6% on a partially diluted basis. On a partially diluted basis, Sprott owns 9.3%. Extract owns 10.6%. First Mining owns 2.1%. Matrix owns 1.0%, and Teck owns 1.0%.
NexGold had 143.6 million shares and a market cap of CA$100.1 million, prior to the closing of its recent CA$10 million bought deal private placement financing. Sign up for our FREE newsletter at: www.streetwisereports.com/get-news
Important Disclosures:
- NexGold Mining Corp. a billboard sponsor of Streetwise Reports and pays SWR a monthly sponsorship fee between US$4,000 and US$5,000.
- As of the date of this article, officers and/or employees of Streetwise Reports LLC (including members of their household) own securities of NexGold Mining Corp.
- James Guttman wrote this article for Streetwise Reports LLC and provides services to Streetwise Reports as an employee.
- This article does not constitute investment advice and is not a solicitation for any investment. Streetwise Reports does not render general or specific investment advice and the information on Streetwise Reports should not be considered a recommendation to buy or sell any security. Each reader is encouraged to consult with his or her personal financial adviser and perform their own comprehensive investment research. By opening this page, each reader accepts and agrees to Streetwise Reports’ terms of use and full legal disclaimer. Streetwise Reports does not endorse or recommend the business, products, services or securities of any company.
For additional disclosures, please click here.

( Companies Mentioned: NEXG.V:TSXV; NXGCF:OTCQX; TRC1.F:FRA,
)
Ghana gold: Foreigners ordered to exit local trading market to boost revenue BBC
Categories
Gold Sets New Record – TradingView
Gold Sets New Record TradingView
Ghana orders foreigners to exit gold market by April 30 Reuters
Shares fall in Asia as Nvidia curbs fan worries, gold hits record Reuters