Gold continues to surge, record high hit above US$3271 TradingView
Category: Gold
Categories
Tariffs Aggravate Trends Already Underway
Source: Adrian Day 04/14/2025
Instead of looking at company news as he usually does, Global Analyst Adrian Day looks at the impact of Trump’s tariffs on the economy and markets.
President Trump’s tariffs were more aggressive than generally expected, introducing the highest U.S. tariff rates in more than a century, with a 10% baseline tariff for all countries and goods with few exemptions. These include copper, gold, energy, critical minerals (not available in the U.S.), pharmaceuticals, and semiconductors.
The tariffs are the centerpiece of the Administration’s economic program aimed at making foreigners pay more and returning manufacturing to the U.S., and can be seen at the spearhead of the so-called Mary-A-Lago Accord, which we have discussed before. Already, the first quarter of the year looks completely different, both in terms of policy and market behavior, from previous years, and it gives a foretaste of what we can expect over the next four years.
Above all else, we can expect uncertainty and, with it, volatility. The economy may see a slowdown in economic growth along with persistently high inflation. In the markets, the winners of the last four years — U.S. stocks, tech, the dollar — may not be the winners of the period ahead. Gold, which has actually gained more than the S&P Index over the past four years, will continue to shine: it responds well to uncertainty, whether geopolitical, economic, or monetary.
Amid Stubborn Inflation, the Economy Was Weakening Before Tariffs
The threat of and the imposition of tariffs may have provoked many of these moves, but in reality, the trends, both in the economy and markets, were already underway or in the cards before Trump took office. We have argued before that the U.S. economy was already heading toward recession, with sluggish consumer spending amid a tapped-out consumer.
Manufacturing had been down for several quarters. Recent job’s reports, with high numbers of government and part-time workers as well as constant revisions, were not as strong as headlines would suggest. Friday’s apparently strong pre-tariff report was not as solid as it would first appear. State and local government workers increased by 23,000 (against just 4,000 fewer federal government workers), and the report was accompanied by a large revision to the prior months’ numbers, down 40,000. Price inflation has been tending upward since last July and remains noticeably above both where it was pre-COVID and the Federal Reserve’s own arbitrary inflation target.
This points to stagflation ahead, and this scenario has been gaining much traction among leading analysts. Goldman Sachs, for example, has increased its price inflation targets and says that the risk of recession is now at 35%. Bank of America now says stagflation is their “new base case.”
Stocks Remain Expensive as Long-Term Weakness Starts
And the stock market, despite new index highs, was as overvalued and overextended as it had ever been, ending the year with the worst breadth ever. This was a market ready for a correction. The Trump tariffs may push the economy and markets and make the near-term decline worse, but the direction of travel has already been determined.
U.S. stocks remain overvalued, even after this past week’s declines, still trading above 20 times earnings. The recent decline takes the market back to where it was only a year ago; it has been sharp, but by no means have we seen the kind of capitulation that markets long-term market lows. What we have seen already this year is but a foretaste of what could be an extended period of decline.
That decline will see a rotation out of the erstwhile leaders and into markets and sectors that have lagged or that offer attractive valuations. In the immediate term, we could see a contrarian bounce — the mid-March rally was very meager — but further out, we suspect the S&P will be lower. The American Association of Individual Investors sentiment index has its third-highest bear reading in its history,y back to 1987. Significantly, the two highest were right at the bear-market lows in October 1990 and March 2009.
Friday, April 4, saw 15 new highs on the New York Stock Exchange against well over 1,000 new lows; such lop-sidedness could be a sign of shortterm bottom. After a strong bounce, however, I suspect we shall see an extended period of weakness, and will not see the early February highs again for a long time.
What Assets, Sectors, and Markets Will Do Well if US Stocks Decline?
If we do see an extended period of weakness in the stock market, history would suggest that short-term Treasuries and gold are the assets most likely to do well; other commodities also often do well. And even within equities, some markets and sectors start to outperform as the old leaders fall. These include defensive and dividend-paying stocks, as well as small-cap value. Global markets could also benefit from the weakness in the U.S. market; they have experienced the longest period of underperformance relative to the U.S. ever.
But a change was already underway. In the first quarter, just before the tariffs were announced, stocks outside the U.S. (per Morgan Stanley-Capital International World Ex-U.S. Index) were up 6.5% this year, against a negative 4% plus for U.S. stocks. Even after the sharp declines in global markets after the tariffs, non-U.S. stocks are still positive for the year against declines of almost 14% for the S&P and over 19% for the tech-heavy Nasdaq. In the U.S., growth stocks, which have dramatically and consistently outperformed value since the Great Financial Crisis, the trends have reversed, with value now outperforming growth and small-cap value even more so.
These styles, sectors, and markets are the ones that should outperform in the next period. The extent to which various groups outperform depends largely on how the dollar, interest rates, inflation, and other economic factors perform. Rising interest rates would dampen returns on dividend-paying stocks, while a declining dollar should help emerging markets, for example.
Drivers of Gold’s Bull Market Remain
But, the sector most likely to outperform is the commodity sector, and within that, gold has the best risk-reward profile. Though commodities are generally likely to outperform, they have a risk that gold will not, namely a sharp economic slowdown in China and global economic retraction.
Gold, however, does not have that risk. We have discussed several times why gold has been going up, and the drivers for gold demand are still intact. The Trump agenda will do nothing to change these drivers: the weaponization of the dollar remains, the threat to the Chinese economy remains, and unsustainable government deficits remain.
None of this is likely to change, and gold thus is likely to continue to move higher, notwithstanding a near-term overdue pullback. TD’s analyst calls gold “overextended but not overbought,” which is exactly right. It has moved well above the trend line, but there is yet no manic buying, certainly not in North America; indeed, premiums on coins and bars tell the opposite story.
Commodities, Very Undervalued, Could Soar
As for the broad commodity complex, it is close to century-long lows relative to financial assets. Analysts Goehring & Rozencwajg have note that every past commodity bull market has been set in motion by a shock to the global monetary system, citing 1929 (end of the return to the gold standard), 1969 (end of Bretton Woods), and 1999 (end of the dollar pegs).
“A major shift in the global monetary system may be imminent,” and commodities are already responding to this. “If gold is the canary in the mine, it is singing loudly,” they write.
Each of those previous troughs in commodity prices against financial asset prices, was followed, not only by strong bull markets in commodities but also by weakness in stock markets. After the 1929 peak, the Dow fell 88%. After 1969, stocks took seven years to exceed their high, while the S&P did not reach its dot-com bubble highs again until 2007, and then only very briefly, not to move sustainably higher until 2013.
The Fed Will Change Policy
Federal Reserve Chairman Jerome Powell now says that tariffs could have a persistent inflationary impact rather than have the one-off, temporary adjustment he saw just a couple of weeks ago. In a speech on Friday, he reiterated the Fed’s wait-and-see approach, but the market is now betting on four rate cuts this year.
Perhaps more important than rate cuts will be a new round of Quantitative Easing that we forecast last week. This will help the bond market but will not be sufficient to help the economy or the stock market meaningfully.
TOP BUYS this week include Ares Capital Corp. (ARCC:NASDAQ), Altius Minerals Corp. (ALS:TSX), Pan American Silver Corp. (PAAS:TSX; PAAS:NASDAQ), Midland Exploration Inc. (MD:TSX.V), Lara Exploration Ltd. (LRA:TSX.V), Orogen Royalties Inc. (OGN:TSX.V), Metalla Royalty & Streaming Ltd. (MTA:TSX.V; MTA:NYSE American), and Fox River Resources Corp. (FOX:CSE). We should warn, however, that if the markets open down on Monday, all the above stocks, to greater or lesser degrees, will likely trade down, and you may be able to buy for less during the day. If, however, the markets open up and begin their recovery rally, I don’t expect them to run away from us.
Sign up for our FREE newsletter at: www.streetwisereports.com/get-news
Important Disclosures:
- As of the date of this article, officers and/or employees of Streetwise Reports LLC (including members of their household) own securities of Altius Minerals Corp., Pan American Silver Corp., Midland Exploration Inc., Lara Exploration Ltd., Orogen Royalties Inc., Metalla Royalty & Streaming Ltd. , and Fox River Resources Corp.
- Adrian Day: I, or members of my immediate household or family, own securities of: All. My company has a financial relationship with: All. I determined which companies would be included in this article based on my research and understanding of the sector.
- Statements and opinions expressed are the opinions of the author and not of Streetwise Reports, Street Smart, or their officers. The author is wholly responsible for the accuracy of the statements. Streetwise Reports was not paid by the author to publish or syndicate this article. Streetwise Reports requires contributing authors to disclose any shareholdings in, or economic relationships with, companies that they write about. Any disclosures from the author can be found below. Streetwise Reports relies upon the authors to accurately provide this information and Streetwise Reports has no means of verifying its accuracy.
- This article does not constitute investment advice and is not a solicitation for any investment. Streetwise Reports does not render general or specific investment advice and the information on Streetwise Reports should not be considered a recommendation to buy or sell any security. Each reader is encouraged to consult with his or her personal financial adviser and perform their own comprehensive investment research. By opening this page, each reader accepts and agrees to Streetwise Reports’ terms of use and full legal disclaimer. Streetwise Reports does not endorse or recommend the business, products, services or securities of any company.
For additional disclosures, please click here.
Adrian Day Disclosures
Adrian Day’s Global Analyst is distributed for $990 per year by Investment Consultants International, Ltd., P.O. Box 6644, Annapolis, MD 21401. (410) 224-8885. www.AdrianDayGlobalAnalyst.com. Publisher: Adrian Day. Owner: Investment Consultants International, Ltd. Staff may have positions in securities discussed herein. Adrian Day is also President of Global Strategic Management (GSM), a registered investment advisor, and a separate company from this service. In his capacity as GSM president, Adrian Day may be buying or selling for clients securities recommended herein concurrently, before or after recommendations herein, and may be acting for clients in a manner contrary to recommendations herein. This is not a solicitation for GSM. Views herein are the editor’s opinion and not fact. All information is believed to be correct, but its accuracy cannot be guaranteed. The owner and editor are not responsible for errors and omissions. © 2023. Adrian Day’s Global Analyst. Information and advice herein are intended purely for the subscriber’s own account. Under no circumstances may any part of a Global Analyst e-mail be copied or distributed without prior written permission of the editor. Given the nature of this service, we will pursue any violations aggressively.


Source: Michael Ballanger 04/14/2025
Michael Ballanger of GGM Advisory Inc. shares his thoughts on the current state of the market and movements in his trading account.
What a difference sixteen days make.
I departed Canada for the United Kingdom on March 26 with every intention of forgetting about the investment landscape in favor of a magical tour of the Cornwall region of England, where my maternal grandparents were born and raised before they emigrated to Canada at the turn of the 19th century.
The afternoon of departure the price of gold closed at $3,052.30, but by the following Tuesday, amidst the total unraveling of the U.S. bond market, gold had touched $2,970.30 as the scramble for liquidity forced gold investors to dump their positions to meet margin calls on stocks and in the case of the hedge fund community, massive cash calls leading to forced liquidation of one of those “financial weapons of mass destruction” — the “basis trade.”
Always designed by the “smartest guys in the room,” the basis trade uses massive leverage in bonds, sometimes as high as 20:1, which means that a 5% move against these rocket scientists can totally vapourize positions — which is exactly what happened once Donald Trump announced the surprisingly-harsh tariff rules that spooked everyone from the lowly odd-lot day trader to the biggest hedge funds on the planet. As we always see when leverage gets unwound, the margin clerks did not wait around for the “best bid possible” but instead sought out “every bid possible” and blasted those bond positions into the stratosphere.
The yield on the 10-year treasury, which had collapsed under the weight of the crashing stock and crypto markets, suddenly spiked from a 3.85% low on April 4 to a high of 4.592% as I was flying back across the Atlantic six days later.
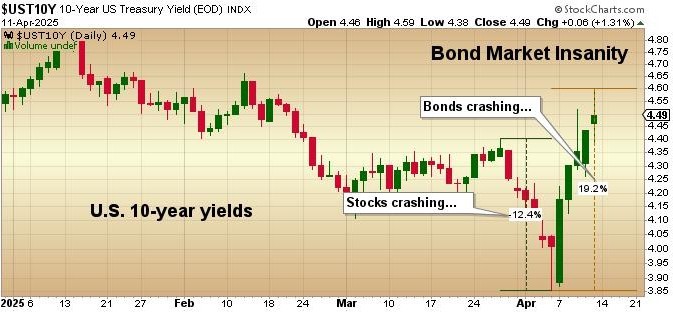
To have the conservative, historically-dependable U.S. treasury bonds crash 12.4% in six days only to reverse higher by 19.2% five days later is volatility of the “Armageddon” variety. Volatility such as the likes of this are symptomatic of a financial system under duress and, in this case, extreme duress, and if there is one thing that can kick the bank-owned Federal Reserve into full panic mode, it is an event like the one we just witnessed last week.
What surprised me was that all of the media coverage was centered on the White House while the Fed and Jay Powell remained eerily silent. With rumors of margin troubles haunting hedge funds like Citadel and ExodusPoint, what the bubbleheads at CNBC refused to divulge was where these funds source the leverage to place 20:1 leveraged bets on T-bonds. Of course, we all know that big money-center banks like JP Morgan and Bank of America extend the loans, and it is usually their compliance and risk managers that lower the liquidation boom.
Now, you all recall my analogy of the “pigs in the barnyard” from past missives. There are pink ones and brown ones and even a few black and white ones, but when the farmer’s wife begins to ring the triangle to signify that the trough has now been filled with all kinds of slop, every pig, regardless of age, creed, or color comes waddling across the yard to partake of the feast.
Well, that is no different from those big, waddling money-center banks. The fees they earn on loans to the hedge fund community are extremely lucrative, and when the U.S. bond market begins to ring the triangle each time another big treasury financing needs to be placed, the banks waddle over to the trough for the frenzy. This is why I found the silence so deafening, with literally no comment whatsoever from Powell and Co. In the post-FOMC meeting interviews that we see every six weeks that are telecast all over the world, Jerome Powell has mentioned “systemic risk” as the only condition other than “maximum full employment” and “price stability” that can alter the Fed’s monetary policy. I might submit that a 12.4% crash followed by an immediate 19.2% spike might be construed as a “systemic event” worthy of at least a one-line statement. However, they said nothing.
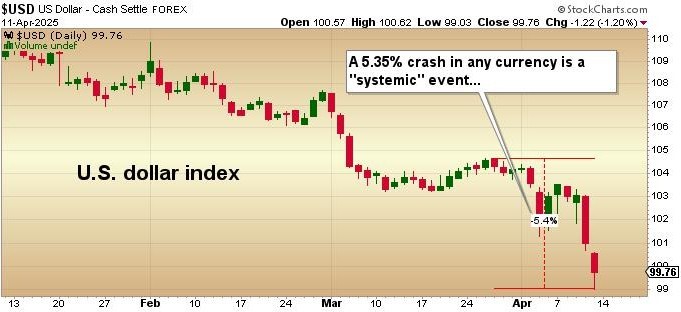
Also contributing to this maelstrom of volatility was the action in the U.S. dollar index.
Dollar bulls have been riding high on a wave of complacency for the better part of the past 14 years, although the actual top in late 2022 above 115 was undoubtedly a secular top despite all the ramblings about “American exceptionalism” and “milkshake theories.”
The fact that the dollar index gave up over 1.8% on Friday alone is a testimonial to a global exodus from U.S. assets, which includes stocks, bonds, and real estate, as investors look to repatriate their funds away from the hostility of U.S. tariff rules and potentially confiscatory measures as experienced by Russia after their invasion of Ukraine.
Trump and his lieutenants better have engaged in extensive “game theory” exercises when they elected to embark on this campaign of trade-related murder and mayhem. As anticipated, the global investment community is casting its judgment in a most exacting manner.
Stocks
From the perspective of the professional trader, the lows of last week on Monday turned out to be the lows for the current decline. Subscribers were told on Monday:
“This <adding to positions> is what I am doing with my cash. I am not “buying the dip” because the Fed has my back; I am adding to grossly undervalued positions that have great teams shepherding my money.”
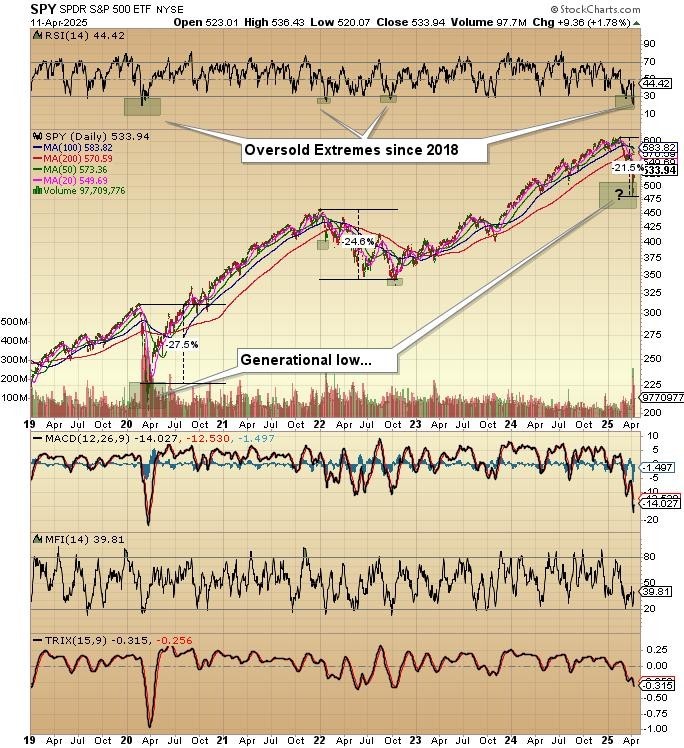
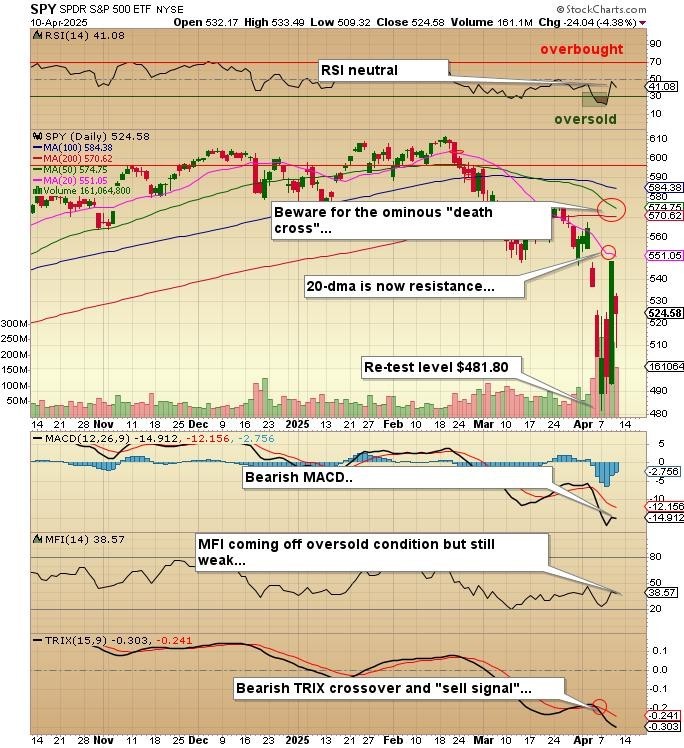
As convinced as I am that 2025 high at $613 for the SPY:US will prove to be the high for the current bull market, technically it was only into bear market territory for only the briefest of moments. At the intraday low of $481.80, the SPY:US was down 21.4% from the top, but at Friday’s closing bell, it was only (tongue-in-cheek) down 12.9%, so for the decline, it is still in “correction” territory having recovered from the same amplitude of decline that we saw in the period of 2022-2023 (∞ -24.5%).
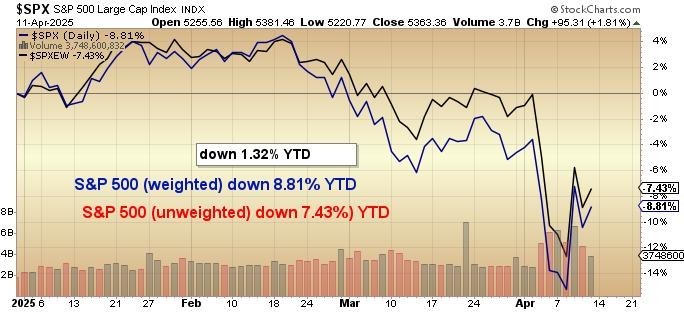
The damage in the U.S. equity markets has been severe enough to have the weighted S&P with all of the overweighted Mag Seven stocks now underperforming the unweighted S&P. The “AI” bubble has now popped, and as I have been writing for a few months now, whenever a bubble as drastically over-owned and over-hyped as the AI bubble pops, they rarely (if ever) resume leadership when the ensuing bottom finally arrives.
For a metal investor such as I, this crack in the bubble should cause a stampede into the hard asset, safe-haven type stocks that I believe will closely resemble the Stagflation ‘70’s which means that the metals led by gold and copper and energy will be the preferred points of sanctuary for portfolio managers the world over.
In the near term, I think stocks can rally for a while longer. Perhaps up to as high as the 200-dma for the SPY:US at around $570.59. That is a 6.4% advance from current price levels, and while it sounds like it is a very real possibility, I think that the violence of this past two weeks in not only stocks but bonds and the U.S. dollar makes a re-test of the lows at $481.80 a strong likelihood.
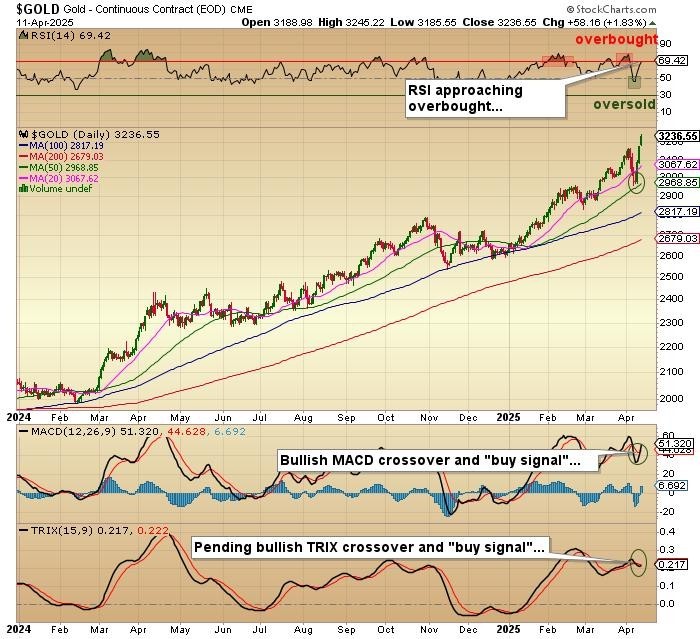
Importantly, it will be the behaviour of the market in terms of breadth and leadership that sets up either a longer duration recovery rally or a resumption and re-emergence of the bear market that snarled ever so briefly on Monday of last week. With an RSI approaching 20 and CNBC anchors all downing valiums like chocolate raisins at a child’s birthday party, calling the lows from lovely Selsey, England was about as seamless as it gets.
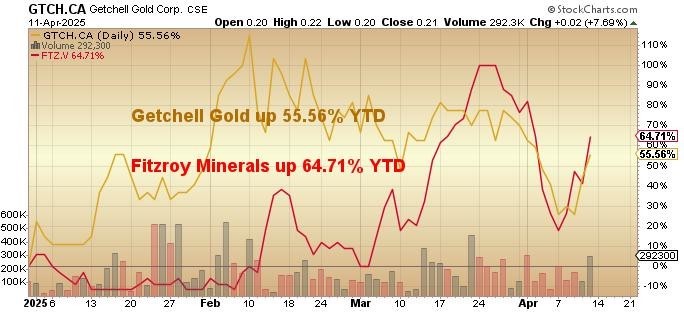
I added to my two favorite junior issues early last week with fortuitous pick-offs in Fitzroy Minerals Inc. (FTZ:TSX.V; FTZFF:OTCQB) (at CA$0.215 and below) and Getchell Gold Corp. (GTCH:CSE; GGLDF:OTCQB) (at $0.20 and below). I also added to my beloved Freeport-McMoRan Inc. (FCX:NYSE) (at $30 and below), which had the audacity to get jumbled together with everything else not nailed down and despite firm copper and screaming gold prices. It hit a forced liquidation low on the Monday crash day of $28.50.
Sporting an RSI well under the magical oversold 30 level, I was a buyer all day long on both Monday and Tuesday. What prompted me to get so aggressive was the action in copper, which grabbed a foothold above the $4.00/lb. level on both days before rallying to close near its respective highs again on both days.
As the copper futures were getting scooped up aggressively, I sent a note to subscribers suggesting that “someone or something is getting blown up,” meaning that it looked, felt, and smelled like either a large investor or a fund was going through a forced liquidation where everything in it was getting tossed summarily overboard. By Wednesday, with the average daily volume shrinking down to its normal level, the stock embarked on a decent rally and went out on the week at $33.35, up sharply from the Monday crash low but still nigh on $10 below where it was the day before L departed for the U.K. For the record, I would still be a buyer and still think the market is short-changing FCX by completely overlooking the 30% of revenues from gold production.
One last chart to show for the SPY:US includes a look at the looming convergence of the 50- dma and 200-dma moving averages, which, once completed, takes on the ominous moniker of the all-encompassing “death cross,“ a truly powerful technical signal and one that historically confirms the arrival of a bona fide bear market.
I called for the arrival of the “Papa Bear” back in the GGMA 2025 Forecast Issue, thanks largely due to my concern over fiscal austerity and the threat of tariffs. Like the first term of the Reagan years, it took until May 1981 for investors to lose the enchanted glow of “Morning in America,” while it took not quite as long for them to jettison “American Exceptionalism” and its ability to “Make America Great Again” in 2025.
Watch for that “death cross” in the upcoming sessions, and it if arrives, be sure to put back the hedges that we were holding when I left for London two weeks ago.
Gold
What can I say about the price of gold?
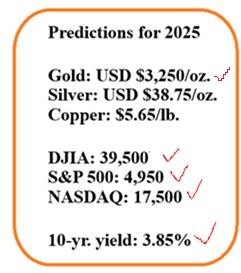
When I was writing the forecast issue back in mid-December, gold was at around $2,700. To the left is the graphic that laid out my price targets for all of the major asset classes that I follow.
In that time frame, since I published the GGMA 2025 Forecast Issue, gold has surpassed my target while the DJIA, the S&P 500, and the NASDAQ have all crumbled below my bearish price targets. I called a low for the yield on U.S. 10-year treasury bonds back in December at a time when they were quoted at a 4.50% yield.
They hit 3.85% on April 4, leaving only two of my forecasts to be realized before I take the proverbial victory lap.
To be completely honest, the only asset that is yet to be achieved, but nevertheless, that belongs above my 2020 forecast, is copper. The mainstream narrative in the crash to $4.00 after “Liberation Day” shocked the world was that copper was going to suffer in the impending recession that would be triggered by those dastardly tariffs.
However, I refute that wholeheartedly because the tariffs are not going to prevent China from expanding its electrical grid to accommodate those 50-plus new modular nuclear reactors currently under construction. They also cannot prevent the degradation of the global copper supply through exploitation without replacement, which is the function of WOKE and/or DEI anti-mining policy regimes in many of the copper-rich producing regions.
The world is going electric whether or not the White House, either by legislation or executive order, demands and promotes the “Drill, baby, drill” campaign while it last week came out in favor of coal, which most certainly will have the leftist global warming drum-beaters up in arms and in need of Prozac, Jack Daniels, and a frontal lobotomy.
Back to gold, if there is one commanding attribute that gold holds, it is that it has always been a harbinger of cataclysmic change and/or strife. As if it had a built-in radar screen, gold bolted through the $3,000 level days before “Liberation Day,” having started the advance in late February even as stocks were still mesmerized with the Republican landslide and investor class love affair. While the CNBC anchors were all enjoying smug little “group hugs” and “wink, wink, nudge, nudge” nods of collective patreonism, the gold market was being groomed for its ultimate utility as a very safe place to have one’s wealth in light of a broken bond market and insanely-overvalued stock market.
The White House did not see it coming; the Fed elected to take a “wait and see” approach; the Wall Street strategists did not see it and were actively advising a “long and strong” portfolio approach, and the financial media led by the carpetbaggers at CNBC did not see it either but still remained living, breathing embodiments of the word “complacency.”
The one entity that “got it” in spades was gold. With my second largest holding in a junior developer with a sizable resource (2.317 million ounces in Nevada) trading a little over $12 per ounce of in-ground gold, Getchell Gold Corp. (and many others like it) is poised to enjoy the fruits of gold’s labor as it resides $4 per ounce above my 2025 forecast price of US$3,250 per ounce. As this golden bull gathers momentum thanks largely to the impending rotation away from paper and into hard assets, junior gold developers will be valued closer to $150-200 per ounce of in-ground gold versus the ridiculous levels under $25 per ounce where they are being valued today.
It will take time but it IS coming.
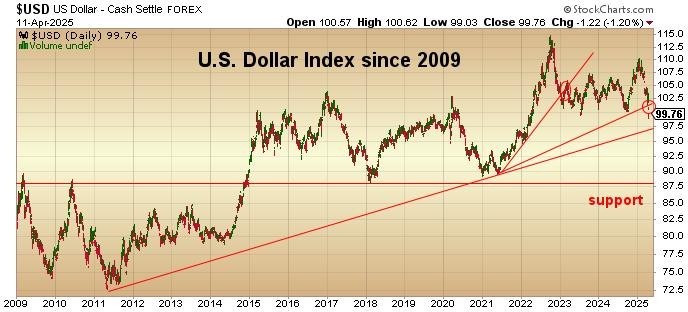
Since the U.S. dollar has finally succumbed to an “Emperor’s New Clothes” type of revelation brought about by the abrupt and shocking revelation that America has a sovereign debt problem, the break of the century mark for the dollar index marks the start of a secular unwinding of the “dollar supreme” era where foreign investors kept buying day in and day out into the “cleanest dirty shirt” impression of the American Treasury bond.
The investor class that has used treasuries to comprise the 40% portion of the 60-40 portfolio model is now being forced kicking and screaming to use something other than U.S. treasuries, and that, for many, is now gold. I am obviously going to need to re-think my strategy on gold as to not only the target price but also whether this explosion in price is event-driven or not. Just as easily as the stock price rallied nearly 3,000 points on a pause in the tariffs last Wednesday, the gold price rallied over $200 in three days alongside stocks, which is somewhat of a departure.

In the end, I own gold for all of the reasons I laid out when I launched this service back in January 2020. The only way the U.S. Treasury can refinance the $7 trillion of new debt is to collateralize it with portions of that 8,311 metric tonnes of gold currently held on behalf of the treasury, and that does not work at USD $3,254 per ounce. At 10% coverage, they would need a gold price of $12,627 per ounce to act as a protective buffer, and that would use only the $37 trillion of national debt without provision for entitlements like Medicare and Social Security.
With a backdrop like that, of all the sub-groups and sub-sectors, the junior gold developers are the most highly leveraged to the current gold price, followed by the explorers. Non-producers with an economically viable resource (like Getchell) will provide investors with a low-risk method of recovering the substantial losses they are incurring (or have incurred) in technology or crypto thus far in this most challenging Year of Our Lord 2025, a year that has brought entirely new meaning to the word “shrinkage.” One look at most non-gold portfolio statements is worth more than a long swim in the North Sea in June.
GGMA 2025 Portfolio Account:
No new positions were taken. The correction of the past two weeks knocked portfolios back after a superb month of March with the absurdity of the pullbacks in both Getchell and Fitzroy. I sold none of either.
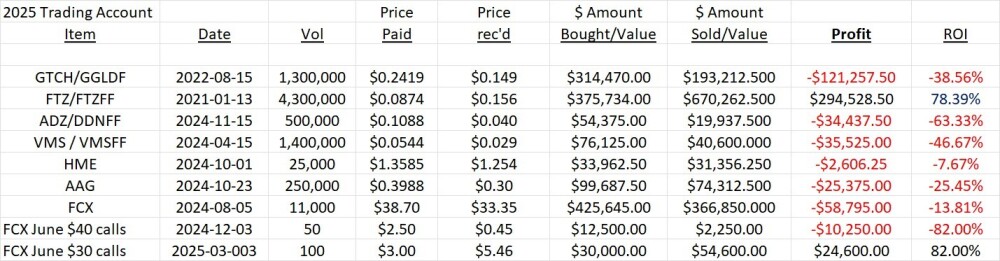
GGMA 2025 Trading Account:
I added to 300,000 FTZ/FTZFF and 100,000 GTCH/GGLDF as well as 1,000 FCX and 50 additional FCX June $30 calls at $3.00 (now long 100). I sold the VIX April $25 calls for $8.20, having paid $2.50 back in February and riding them underwater until last Monday. By Wednesday, of course, they were at $16.50, but with everything whipping around like a headless chicken, I took the trade and left another $8.00 (US$40k) on the proverbial table.
With gold at $3,254, Getchell is a cinch to see higher prices over the next year or so. These juniors need capital flow, and that will come as funds trickle down from seniors to the intermediates and then ultimately to the juniors, then the explorers. Of course, big, new discoveries will attract capital quicker than simply relying on existing resources, which is why GTCH/GGLDF needs to get that warrant money so they can go after a Tier Two or, hopefully, Tier One category for Fondaway Canyon. I definitely think it is doable, but money will call the shot.
FTZ/FTZFF needs absolutely nothing other than the continuation of the three active and fully- funded drill programs in order to advance to all-time highs. Management is eager to re-commence with drilling at Caballos, and that is important because drilling will be ending around the end of June as Chilean winter will come fast. They can drill all year round at Polimet and Buen Retiro, but the excitement will be the next 3-4 holes at Caballos. This holding represents 21% of the GGMA 2025 Trading Accoun,t which is why I have such high expectations for the account.
Sign up for our FREE newsletter at: www.streetwisereports.com/get-news
Important Disclosures:
- As of the date of this article, officers and/or employees of Streetwise Reports LLC (including members of their household) own securities of Fitzroy Minerals Inc. and Getchell Gold Corp.
- Michael Ballanger: I, or members of my immediate household or family, own securities of: All. My company has a financial relationship with: All. I determined which companies would be included in this article based on my research and understanding of the sector.
- Statements and opinions expressed are the opinions of the author and not of Streetwise Reports, Street Smart, or their officers. The author is wholly responsible for the accuracy of the statements. Streetwise Reports was not paid by the author to publish or syndicate this article. Streetwise Reports requires contributing authors to disclose any shareholdings in, or economic relationships with, companies that they write about. Any disclosures from the author can be found below. Streetwise Reports relies upon the authors to accurately provide this information and Streetwise Reports has no means of verifying its accuracy.
- This article does not constitute investment advice and is not a solicitation for any investment. Streetwise Reports does not render general or specific investment advice and the information on Streetwise Reports should not be considered a recommendation to buy or sell any security. Each reader is encouraged to consult with his or her personal financial adviser and perform their own comprehensive investment research. By opening this page, each reader accepts and agrees to Streetwise Reports’ terms of use and full legal disclaimer. Streetwise Reports does not endorse or recommend the business, products, services or securities of any company.
For additional disclosures, please click here.
Michael Ballanger Disclosures
This letter makes no guarantee or warranty on the accuracy or completeness of the data provided. Nothing contained herein is intended or shall be deemed to be investment advice, implied or otherwise. This letter represents my views and replicates trades that I am making but nothing more than that. Always consult your registered advisor to assist you with your investments. I accept no liability for any loss arising from the use of the data contained on this letter. Options and junior mining stocks contain a high level of risk that may result in the loss of part or all invested capital and therefore are suitable for experienced and professional investors and traders only. One should be familiar with the risks involved in junior mining and options trading and we recommend consulting a financial adviser if you feel you do not understand the risks involved.

Source: Streetwise Reports 04/14/2025
AbraSilver Resource Corp. (ABRA:TSX; ABBRF:OTCQX) secured 100% of its Diablillos project in Argentina with a US$6.85M payment, setting the stage for high-grade expansion and value growth. Read more to see why analysts say the project’s upside remains strong heading into the next development phase.
AbraSilver Resource Corp. (ABRA:TSX; ABBRF:OTCQX) has completed a key financial milestone by making the final property payment of US$6.85 million to EMX Royalty Corp., securing full ownership of the Diablillos silver-gold project in Salta Province, Argentina. The payment, originally due by July 31, 2025, was made ahead of schedule and reflects a reduced obligation from the originally anticipated US$7.0 million. This transaction fulfills all obligations under the amended share purchase agreement dated March 21, 2017.
With this payment, AbraSilver now holds 100 percent of the Diablillos project, a significant development in its ongoing efforts to advance toward production. John Miniotis, President and CEO of AbraSilver, stated in a company news release, “The completion of this final payment marks a key milestone for AbraSilver. By making this payment early, we have further strengthened our financial position while maintaining our focus on rapidly advancing the Diablillos project toward production.”
EMX’s royalty interest in Diablillos originated from its 2021 acquisition of a portfolio of royalty interests and payments from SSR Mining Inc. and its subsidiaries. EMX continues to hold a 1.0 percent net smelter return (NSR) royalty on the project. A net smelter return royalty refers to a percentage of the revenue generated from the sale of minerals extracted from a project after deducting certain costs associated with processing and transportation.
The Diablillos project contains proven and probable reserves of 42.3 million tonnes grading 91 grams per tonne silver and 0.81 grams per tonne gold, for a total of 209 million silver-equivalent ounces. A December 2024 pre-feasibility study (PFS), based on prices of US$25.50 per ounce silver and US$2,050 per ounce gold, outlined a Net Present Value at a 5 percent discount rate (NPV5%) of US$747 million and an internal rate of return (IRR) of 28 percent, with a two-year payback period. The project’s all-in-sustaining cost (AISC), which includes operating costs, royalties, sustaining capital, closure costs, and general and administrative expenses, was estimated at US$12.67 per silver-equivalent ounce.
EMX’s retention of an NSR royalty ensures continued interest in the project’s future performance as AbraSilver advances Diablillos through further development and exploration.
Silver Sector Dynamics: Undervalued Metal Faces Persistent Deficits Amid Industrial Demand Surge
The silver sector continued to demonstrate signs of tight supply and rising demand through early April, driven by both macroeconomic conditions and fundamental shifts in industrial consumption.
According to a March 30 article by Richard Mills on Ahead of the Herd, silver was expected to post a fifth consecutive annual supply deficit in 2025. The anticipated shortfall, estimated at 149 million ounces, followed four years of structural deficits and highlighted the ongoing mismatch between supply and demand.
Krauth also addressed the company’s market performance, observing that AbraSilver shares had declined by over 30%, more than average but consistent with similar-stage peers. He concluded that this represented an attractive entry point, suggesting the stock had been “oversold” relative to its recent strong performance and ongoing progress.
In that same report, Mills emphasized silver’s dual role as both an investment and industrial metal, with around 60 percent of total silver output used in sectors such as solar energy, electronics, and automotive manufacturing. Citing a study by Oxford Economics, he noted that “demand for industrial applications, jewelry production, and silverware fabrication is forecast to increase by 42% between 2023 and 2033.”
On April 1, Christopher Lewis at FX Empire described the market as “very noisy” and “extraordinarily volatile under the best of times,” though he indicated that silver appeared to have established support at US$33.33 and was attempting to regain bullish momentum.
By April 5, Ahead of the Herd reported that the gold-silver ratio had risen to 102, far above the historical average of 60. Mills reiterated that “silver is significantly undervalued relative to gold at current levels” and pointed to prior periods when silver outperformed following such imbalances. He added that in 2020, “silver’s gain was double that of gold,” and recent economic and geopolitical conditions were beginning to mirror those seen during that time.
Silver’s recent market behavior echoed these historical patterns. Shad Marquitz of Excelsior Prosperity wrote on April 14 that silver futures reached a multi-year high of US$35.50 on March 27 but failed to hold that level due to market volatility spurred by tariff announcements. “Silver’s highest daily close last year was on October 21 at US$35.04,” he explained, adding that recent trading saw “silver futures close at $31.91 on the May contract,” indicating renewed upward momentum.
Despite the price action, investor enthusiasm for silver equities remained tepid. Marquitz observed that “the SILJ made another lower high only making it to $12.98” during silver’s March rally – despite prices reaching the highest level in over a decade – highlighting the lack of speculative fervor in the sector.
Positive Outlook on AbraSilver’s Expansion and Drilling Success
On April 9, Peter Krauth of The Gold Advisor provided a favorable assessment of AbraSilver Resource Corp. following the company’s latest Phase IV drill results from the Diablillos project in Salta, Argentina. Krauth noted that “the results were superb, with numerous high-grade silver intercepts,” highlighting the significance of assays from step-out holes at both the JAC Extension and Oculto Northeast zones. He emphasized that many of these intercepts were located outside the current conceptual open pit, suggesting potential for a larger resource in the upcoming mid-2025 estimate.
According to Krauth, standout results included Hole DDH 24-084, which intersected 63.5 meters grading 190 grams per tonne (g/t) silver, including 9.0 meters at 341 g/t silver. Additional intercepts, such as 70.0 meters at 147 g/t silver and 47.0 meters at 169 g/t silver, were also cited as contributing to expectations for a positive impact on the resource update that will underpin the company’s Definitive Feasibility Study.
Krauth stated that these results demonstrate that “silver mineralization extends farther south and southwest of the current pit outline” and described the intercepts as both wide and shallow, further enhancing their economic relevance. He also highlighted the significance of hole DDH 24-074, which confirmed gold-dominant mineralization outside the existing Oculto resource boundary, indicating further upside potential.
Discussing ongoing exploration, Krauth reported that AbraSilver had commenced its 20,000-meter Phase V program, targeting both the Oculto-JAC epithermal district and the Cerro Viejo gold prospect. He quoted the company’s Chief Geologist, Dave O’Connor, who remarked, “The continuity and consistency of the near-surface silver mineralization we are seeing south of the JAC open pit is quite remarkable.” O’Connor added that the strong results across multiple zones and the number of remaining untested targets would make Phase V a “key role in unlocking further upside across the broader Diablillos system.”
Krauth also addressed the company’s market performance, observing that AbraSilver shares had declined by over 30%, more than average but consistent with similar-stage peers. He concluded that this represented an attractive entry point, suggesting the stock had been “oversold” relative to its recent strong performance and ongoing progress.
Momentum Ahead: What’s Driving AbraSilver’s Next Phase
With the Diablillos project now fully secured, AbraSilver is positioned to move decisively into its next development phase. The company is currently executing a 20,000-meter Phase V drill program aimed at expanding high-grade mineralization across several targets, including the Oculto-JAC epithermal district and the largely unexplored Cerro Viejo gold zone. Initial drill results from Cerro Viejo have already intersected 36.0 meters at 1.91 grams per tonne gold, including a 5.0-meter section at 7.22 grams per tonne gold, starting just 87 meters downhole.
The company has highlighted a number of key upcoming catalysts over the next 12 months in its April 20225 Investor Presentation. These include the expected approval of its Environmental Impact Assessment (EIA), application and potential qualification for Argentina’s RIGI (Regimen de Incentivos para Grandes Inversiones) tax incentive program, and the completion of a Definitive Feasibility Study. The RIGI program could offer significant fiscal advantages for Diablillos, including a reduced corporate tax rate of 25 percent, zero export duties, accelerated depreciation, and 30 years of stability in taxation and customs policy. Total potential savings under RIGI are estimated at approximately US$430 million. [OWNERSHIP_CHART-9164]
AbraSilver is currently fully funded to make a construction decision before the end of 2026, with an estimated CA$65 million in cash and no outstanding warrants. Strategic shareholders, including Central Puerto, Eric Sprott, and Kinross Gold, collectively own approximately 25 percent of the company’s shares, signaling strong insider and institutional support.
In addition to Diablillos, AbraSilver maintains an option to acquire the large-scale La Coipita copper-gold project in San Juan, Argentina. Exploration at La Coipita is currently being conducted by Teck Resources under an agreement that allows Teck to earn up to an 80 percent interest by funding US$20 million in exploration over five years. Initial drill results from this program are anticipated in the second quarter of 2025.
Ownership and Share Structure
AbraSilver’s major shareholders, reported Stanley, are insiders (management and board members) with 3%, Central Puerto SA with 9.9% and Kinross Gold Corp. (K:TSX; KGC:NYSE) with 4%. (In AbraSilver’s recent CA$58.5M financing, Central Puerto invested CA$25M and Kinross invested CA$3M.)
AbraSilver has 152.7 million shares outstanding. Its market cap is CA$517M. Its 52-week range is CA$1.33–3.58 per share. Sign up for our FREE newsletter at: www.streetwisereports.com/get-news
Important Disclosures:
- AbraSilver Resource Corp. is a billboard sponsor of Streetwise Reports and pays SWR a monthly sponsorship fee between US$4,000 and US$5,000.
- James Guttman wrote this article for Streetwise Reports LLC and provides services to Streetwise Reports as an independent contractor.
- This article does not constitute investment advice and is not a solicitation for any investment. Streetwise Reports does not render general or specific investment advice and the information on Streetwise Reports should not be considered a recommendation to buy or sell any security. Each reader is encouraged to consult with his or her personal financial adviser and perform their own comprehensive investment research. By opening this page, each reader accepts and agrees to Streetwise Reports’ terms of use and full legal disclaimer. Streetwise Reports does not endorse or recommend the business, products, services or securities of any company.
For additional disclosures, please click here.

( Companies Mentioned: ABRA:TSX; ABBRF:OTCQX,
)
Goldman Puts $4,000 Gold on the Agenda as Hunt for Havens Grows Bloomberg.com
Gold rate today: Goldman Sachs raises year-end target to $3,300; predicts $4,500 peak in extreme risk case Mint
Goldman Sachs raises end-2025 gold price forecast to $3,700/oz Yahoo Finance
- Gold is having a moment as tariffs make investors nervous Yahoo Finance
- Gold That Flowed Into US in Tariff Bet Now Slowly Trickles Out Bloomberg.com
- $4,000 gold price is coming as risk assets crack, says Bloomberg’s Mike McGlone KITCO
Silver Is About To Outperform Gold; Market Mayhem Is Just Beginning | Peter Grandich The Jerusalem Post
Source: Streetwise Reports 04/11/2025
NevGold Corp. (NAU:TSX.V; NAUFF:OTC; 5E50:FSE) has reported more high-grade gold-antimony results from its Limousine Butte Project in Nevada. Read how the company’s expanding footprint and re-assay strategy could reveal even greater potential.
NevGold Corp. (NAU:TSX.V; NAUFF:OTC; 5E50:FSE) has reported additional high-grade oxide gold-antimony mineralization from the Cadillac Valley area at its Limousine Butte Project in Nevada. The latest drill results build on previous findings and demonstrate the project’s expanding footprint, with mineralization now confirmed along a 5-kilometer strike between Cadillac Valley and Resurrection Ridge.
Highlighted drill intercepts from Cadillac Valley include hole LB22-007, which returned 1.70 grams per tonne (g/t) gold equivalent (AuEq) over 169.2 meters, including 2.85 g/t AuEq over 54.4 meters and 13.15 g/t AuEq over 3.1 meters. These intervals include both gold and notable amounts of antimony, a critical mineral identified by the U.S. Geological Survey. The AuEq calculations were based on metal prices of US$2,000 per ounce gold and US$35,000 per tonne antimony, with assumed recoveries of 85% for gold and 70% for antimony.
Drillhole LB22-006 also produced 1.34 g/t AuEq over 124.7 meters, including 2.23 g/t AuEq over 24.3 meters. Additional intersections from Resurrection Ridge continue to validate the region’s mineral potential, such as LIM-40’s 4.07 g/t AuEq over 54.9 meters, including 6.60 g/t AuEq over 12.2 meters.
NevGold has been re-analyzing historical drill core that had previously been subject to an upper detection limit of 1% antimony. Many intervals exceeded this threshold and are now undergoing re-assay at the American Assay Lab in Reno, Nevada, without the prior analytical constraints. This approach could unlock previously unrecognized value in the data set.
The Cadillac Valley and Resurrection Ridge targets sit within a permitted area approved under the Plan of Operations since November 2024, allowing NevGold to proceed with further drilling. According to CEO Brandon Bonifacio in the news release, “The oxide gold-antimony grades, near-surface mineralization, and hole thickness highlight the significant gold-antimony potential that we have at the Project.”
The development of this project aligns with recent U.S. government policy. On March 20, 2025, the Biden administration issued an executive order invoking the Defense Production Act to accelerate domestic mineral production, explicitly citing antimony’s strategic importance. The order included mechanisms for expedited permitting and access to financial support through a new federal minerals investment fund. The U.S. currently has no domestic source of mined antimony, and approximately 90% of global supply comes from China, Russia, and Tajikistan — countries subject to rising geopolitical tensions.
NevGold’s project data also includes evidence of historical small-scale antimony mining within the Limo Butte boundary, with samples reportedly exceeding 9% antimony content. These findings were supported by archived reports from the Nevada Bureau of Mines and a Brigham Young University thesis.
Gold’s Stability and Strategic Demand Drive Recent Momentum
Gold continued to reinforce its reputation as a reliable safe-haven asset in April, with multiple market developments and policy shifts contributing to its strength. On April 8, 321Gold described the market’s resilience, noting that “gold looks fantastic,” especially following a move from the US$2,956 support level. Stewart Thomson explained that large-scale investors typically use price zones, not individual trades, to accumulate gold, stating that “no soldier goes into a major war expecting to win it with just one battle. Gold market investors need to think less like stock market price chasers do.”
April 9 saw gold surge past US$3,100 per ounce before closing at US$3,079.40, marking its best day since October 2023. According to Reuters that day, the rally was driven by escalating U.S.-China trade tensions and investor concerns over inflation. Bart Melek, head of commodity strategies at TD Securities, said, “Ultimately, gold continues to be seen as a hedge against instability here,” pointing to rising yields and tariff fears as catalysts for the surge. The article noted that gold had already risen more than US$400 in 2025, hitting a record high of US$3,167.57 on April 3.
Maund told Streetwise, “With more good discovery news out of the company this morning and the sector recovering after the shakeout of a few days back as the dollar craters, this looks like an excellent point to buy NevGold.
The same day, Kitco reported that the U.S. market reaction to a temporary tariff suspension contributed to a 3.39% rise in gold futures, with the June contract closing at US$3,099.80. The price increase recovered over half of gold’s recent losses.
The report also highlighted inflows into gold-backed exchange-traded funds (ETFs), with 226.5 metric tons (or approximately US$21.1 billion) added in Q1 2025, the largest quarterly total in three years. These ETF inflows, alongside geopolitical uncertainty, continued to support the sector.
In its April 10 analysis, GoldFix cited Goldman Sachs’ revised 2025 gold price targets, which now included a base case of US$3,300 per ounce, a high-end target of US$3,520, and a tail-risk scenario of up to US$4,500. According to the report, central bank purchases were a key driver, with a new forecast of 70 tonnes per month in official sector buying. The analyst emphasized the structural nature of this demand, particularly from emerging markets, noting that “the geopolitical hedging motive has gained relevance since the freezing of the Russian central bank assets in 2022.”
Goldman’s report also referenced a recent Chinese policy change allowing insurance firms to invest up to 1% of assets under management in gold – equivalent to an estimated 280 tonnes. While flows from this policy had yet to materialize fully, the bank expected this latent demand to act as a stabilizing force during price pullbacks.
Stockhead on April 11 framed gold as a proven safe-haven asset, particularly during periods of economic turmoil. Analysts from TD Cowen observed that “gold equities outperformed the broader market by 16–24% in economic shocks since the year 2000,” including the COVID-19 period and the Bear Stearns collapse. The report also noted that while investor exposure to gold equities remained below historic highs, there had been a recent uptick in generalist interest. TD’s analysts stated, “We view investors as underweight precious metals but we have seen a marked uptick in generalist interest evaluating greater allocation of capital back into the space.”
Positive Technical Setup Draws Analyst Attention to NevGold
On April 10, Technical Analyst Clive Maund provided a positive evaluation of NevGold Corp., highlighting the company’s strong technical setup and recent drill results.
The same day, Maund told Streetwise, “With more good discovery news out of the company this morning and the sector recovering after the shakeout of a few days back as the dollar craters, this looks like an excellent point to buy NevGold after its reaction back of the past couple of weeks from a peak at CA$0.42 to CA$0.29 on light volume to its rising 200-day moving average, which followed a bullish runup on strong volume in the middle of March. A chart has been saved, which we will look at on the site later this morning.”
Maund noted that NevGold’s trading action on April 10 reflected this renewed momentum, with the stock closing at CA$0.31 (US$0.231), up roughly 7% after earlier gains of 12%. He pointed to the company’s recent recovery and its positioning within a rising trend as indicators of technical strength.
Upcoming Catalysts at Limousine Butte
NevGold’s 2025 exploration program at Limousine Butte includes a series of value-driven initiatives focused on expanding its oxide gold-antimony footprint. According to its April 2025 investor presentation, the company is currently re-assaying approximately 20 historical holes for both metals, targeting results that could support the project’s first combined gold-antimony mineral resource estimate.
A second-phase reverse circulation drill campaign is planned, spanning roughly 5,000 meters across high-priority targets at Cadillac Valley and Resurrection Ridge. The mineralization at these zones remains open in multiple directions, and the existing data suggests lateral and vertical extension potential.
Historical production at Limousine Butte dates back to 1989–1990 when approximately 91,000 ounces of oxide gold were mined at the Golden Butte pit. A historical resource estimate from 2009 outlined 241,000 ounces of gold (measured and indicated) at an average grade of 0.78 g/t and an additional 51,000 ounces inferred at 0.70 g/t. While not classified under current NI 43-101 standards, the estimate provides context for the site’s long-term potential. [OWNERSHIP_CHART-10234]
In parallel with its Nevada work, NevGold continues advancing its Nutmeg Mountain project in Idaho and the Zeus copper project, also in Idaho. According to the company’s April 2025 investor presentation, the Nutmeg Mountain asset hosts an indicated gold resource of 1.01 million ounces and an inferred resource of 275,000 ounces based on a 0.30 g/t cutoff. The Zeus copper project, located on the Hercules Copper Trend, shows early signs of strong porphyry copper potential and has entered geophysical and permitting stages ahead of first-phase drilling.
Ownership and Share Structure
Strategic investors include GoldMining Inc., which holds 28.3% of the company on an undiluted basis, and McEwen Mining Inc.
The company said about 30% is held by management and insiders. According to Refinitiv, these include Non-Executive Chairman Giulio T. Bonifacio with 4.56%, CEO Brandon Bonifacio with 3.46%, Independent Director Gregory French with 0.85%, and Independent Director Timothy Dyhr with 0.70%, Refinitiv said.
About 10% is held by institutions, and the rest is in retail.
As for its share structure, NevGold has 94.25 million outstanding shares and 57.25 million free-float traded shares. Its market cap is CA$28.33 million. Its 52-week trading range is CA$0.17 and CA$0.50 per share. Sign up for our FREE newsletter at: www.streetwisereports.com/get-news
Important Disclosures:
- As of the date of this article, officers and/or employees of Streetwise Reports LLC (including members of their household) own securities of NevGold Corp.
- James Guttman wrote this article for Streetwise Reports LLC and provides services to Streetwise Reports as an employee.
- This article does not constitute investment advice and is not a solicitation for any investment. Streetwise Reports does not render general or specific investment advice and the information on Streetwise Reports should not be considered a recommendation to buy or sell any security. Each reader is encouraged to consult with his or her personal financial adviser and perform their own comprehensive investment research. By opening this page, each reader accepts and agrees to Streetwise Reports’ terms of use and full legal disclaimer. Streetwise Reports does not endorse or recommend the business, products, services or securities of any company.
For additional disclosures, please click here.

( Companies Mentioned: NAU:TSX.V; NAUFF:OTC; 5E50:FSE,
)