Canadian company pushes forward with plans for new gold mine in Juneau KTOO
Category: Gold
Australia’s Rocky Economy Rescued By Another Gold Rush Forbes
Where’s the gold? Germany’s conservatives sound the alarm over reserves in the US politico.eu
- Gold sails above $3,100 to uncharted territory as US tariffs approach CNBC
- Gold Rises Above $3,100 for First Time as US Levies Boost Havens Bloomberg.com
- Gold Hits New All-Time High Amid Looming U.S. Tariffs TradingView
i-80 Gold Reports Fourth Quarter and Full Year 2024 Operating and Financial Results Yahoo Finance
Source: Streetwise Reports 03/28/2025
Omai Gold Mines (OMG:TSXV; OMGGF:OTC) reported new drill results from its Wenot deposit in Guyana, including 10.40 g/t gold over 10.5 meters and 2.13 g/t over 48.5 meters. Read more about how these findings could reshape upcoming resource estimates and development plans.
Omai Gold Mines (OMG:TSXV; OMGGF:OTC) has released new assay results from its ongoing 2025 drill program at the 100%-owned Omai gold project in Guyana. The results come from four holes totaling 2,157 meters, including two at the Wenot deposit and two at the nearby Camp zone. The program aims to expand the Wenot resource and test targets beyond the limits defined in the company’s 2024 mineral resource estimate and preliminary economic assessment (PEA).
Hole 25ODD-101 returned multiple high-grade gold intercepts at depth, including 10.40 grams per tonne (g/t) gold over 10.5 meters (capped at 70 g/t), 3.83 g/t over 18.8 meters, and 2.13 g/t over 48.5 meters, including 10.34 g/t over 3.3 meters. These intercepts were encountered below the 2024 PEA pit shell and are located within the historically productive dike corridor and the central quartz feldspar porphyry unit. According to president and CEO Elaine Ellingham, “Hole 101 alone intersected three separate standout intervals of gold mineralization — all of which effectively extend both the 2024 resource limits and the 2024 PEA pit shell.”
Hole 25ODD-099, drilled 200 meters west of Hole 101, intersected multiple mineralized zones, including 3.58 g/t gold over 7.0 meters and 0.97 g/t over 26.0 meters, including 2.92 g/t over 5.0 meters. Several of these intercepts were located within the southern sedimentary sequence, an area management views as underexplored and potentially amenable to near-surface development.
Drilling at the Camp zone, one kilometer west of Wenot, yielded near-surface results such as 0.59 g/t gold over 10.5 meters and 0.42 g/t over 18.41 meters in Hole 25ODD-098. While lower in grade compared to Wenot, these results are geologically significant and suggest the potential for satellite pit development, particularly as they lie along the same shear corridor.
In response to ongoing success, Omai has expanded its 2025 drill campaign from 10,000 meters to at least 15,000 meters. The company reported a strong cash position of approximately CA$30 million, following a financing completed in February. An updated mineral resource estimate is anticipated in Q2 2025, with a revised PEA targeted for Q3 2025.
The Wenot deposit is part of a 2.5-kilometer-long shear system that includes multiple near-vertical mineralized zones. Historically mined from 1995 to 2002, Wenot produced 1.4 million ounces of gold at grades averaging 1.45 g/t. The deposit remains open along strike and at depth, with recent drilling indicating increasing grade profiles at depth.
Gold Prices Reached Historic Highs Amid Strong Demand, Market Shifts, and Resource Revaluation
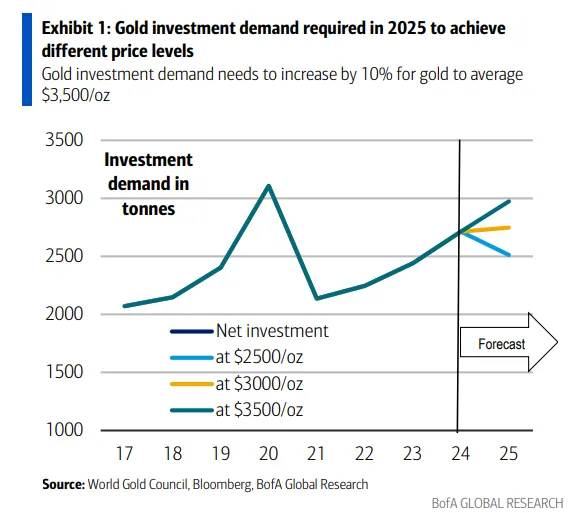
As of late March, the gold sector operated in a historically high pricing environment, with spot and futures prices surpassing significant milestones. Industry commentary also reflected strong institutional outlooks. On March 14, 2025, GoldFix reported that Bank of America had raised its price forecast for gold to US$3,500 per ounce, stating, “We believe gold could rally to $3,500/oz if investment demand increases by 10%.” Goldman Sachs also adjusted its projections, increasing its year-end 2025 target to US$3,300 per ounce with a potential trading range between US$3,250 and US$3,520. In scenarios of extreme market stress, Goldman suggested gold could “plausibly trade above $4,200/oz” and potentially exceed US$4,500 within twelve months.
On March 5, Atrium Research analysts Ben Pirie and Nicholas Cortellucci maintained a Buy rating on Omai Gold Mines Corp. and reiterated a target price of CA$0.80 per share.
Sector momentum was further reflected in equity performance. On March 26, Barry Dawes of Martin Place Securities observed that “gold stocks made a new rally high . . . and are just breaking out.” He described the market as showing signs of renewed investor interest and corporate activity, stating that “the capital markets are freeing up in the resources sector.” Dawes noted a structural change in valuations, with transactions moving from pricing based on operational cash flows to valuations focused on gold resources in the ground.
Commentary on long-term structural changes in the gold market continued to emerge. Egon von Greyerz, in a March 27 article titled Bonfire of the Paper Asset Vanities & The Rebirth of Gold, argued that gold’s recent movement past US$3,000 was not a ceiling but a step in an ongoing trend. “US$3,000 is certainly not a target – it is not even a price where gold will consolidate,” von Greyerz wrote. He described this price level as “an obvious magnet” and positioned gold as a key component of wealth preservation amid systemic financial risks. He also noted that the Dow-to-Gold ratio had declined significantly over the last 25 years, falling from 45 in 2000 to 14 in 2025, reflecting a shift in long-term relative value.
Also, on March 27, the June gold futures contract reached US$3,113.52 intraday, closing at US$3,090.90 — both all-time highs. According to Shad Marquitz of Excelsior Prosperity, “the June gold futures contract pierced the US$3,100 level,” noting that this figure marked “another all-time daily closing high.” He pointed out that this rally was occurring despite some confusion among investors due to different price benchmarks being used across platforms. Marquitz emphasized that the wider market continued to rely on forward-month futures contracts for pricing rather than spot rates.
Resource Growth and Economic Enhancements in 2025
Omai Gold’s exploration strategy is centered on expanding both the scale and economic robustness of the Wenot deposit. The current focus includes testing undrilled areas within the PEA pit, extending subparallel mineralized zones to depths of 400–450 meters, and increasing shallow drilling at West Wenot, where mineralized sedimentary rocks present potential for starter pits.
According to the company’s investor presentation, 87% of Wenot’s 2.4-million-ounce resource lies above 330 meters depth, with very limited drilling below that level. Deeper intercepts, including 4.57 g/t gold over 45.5 meters (hole 87) and 4.48 g/t over 57.0 meters (hole 92), have increased confidence in the project’s vertical potential.
Gilt Creek, the adjacent underground deposit, further strengthens the development case. With 1.8 million ounces in indicated and inferred resources averaging over 3.2 g/t gold, it provides a potential second source of feed. An updated PEA is expected to incorporate both Wenot and Gilt Creek, which were modeled independently in 2024.
The project’s brownfields setting offers logistical and regulatory advantages. It features road access within 10 kilometers of site, an on-site airstrip, existing tailings infrastructure, and a mining-friendly jurisdiction. The Guyanese government has publicly supported the redevelopment of Omai, which historically employed over 1,000 people and produced 3.8 million ounces of gold between 1993 and 2005.
Atrium Research Reaffirmed Buy Rating and CA$0.80 Target Citing Strong Drill Results and Development Upside
On March 5, Atrium Research analysts Ben Pirie and Nicholas Cortellucci maintained a Buy rating on Omai Gold Mines Corp. and reiterated a target price of CA$0.80 per share. The analysts cited ongoing strong drill results as the basis for their continued positive outlook. According to Atrium, the Wenot deposit in Guyana “continues to demonstrate the robust nature” of its mineralization, as evidenced by final assay results from the 2024 drill campaign.
These results included a standout intercept from hole 24ODD-097, which returned 5.21 grams per tonne gold (g/t Au) over 19.3 meters, including 11.44 g/t Au over 4.6 meters and 11.75 g/t Au over 3.6 meters. Atrium also noted encouraging assays from hole 24ODD-096, with 0.98 g/t Au over 26.2 meters, and from hole 24ODD-093, which yielded 1.89 g/t Au over 6.7 meters and 2.51 g/t Au over 4.9 meters.
The analysts emphasized that Omai’s 2025 drill program had already completed eight holes totaling 4,880 meters, with results pending at the time of publication. They expressed optimism about the upcoming mineral resource estimate expected in Q2 2025 and the updated Preliminary Economic Assessment (PEA) planned for Q3 2025. Atrium stated they anticipated “a material increase in the size of the deposit beyond the already large 2.45Moz at Wenot,” which they believed could result in a “step change to the economics in the updated PEA.”
In their valuation, Atrium incorporated assumptions for the Gilt Creek deposit and projected an increase in the project’s NPV5% from US$777 million to US$1.233 billion at a gold price of US$2,200 per ounce. They applied a conservative 0.25x multiple to their modeled NPV of CA$1.8 billion to derive the CA$0.80 price target, representing a 135% upside from Omai’s share price at the time of the report. [OWNERSHIP_CHART-10474]
The firm also highlighted Omai’s logistical advantages as a brownfields site, including existing road and runway access, proximity to a developing hydropower project, and historical metallurgical recoveries of approximately 92%. These factors were seen as important strengths supporting continued development at the project.
Ownership and Share Structure
According to Refinitiv, management and insiders hold 1.63% of Omai Gold Mines while institutions own 8.91%. Of them, Mackenzie Investments owns 4.08%, Schroder Investment Managment owns 1.6%, and Franklin Advisers Inc holds 1.23%. The rest is retail.
Omai has a market cap of CA$174.98 million, 610.45 million outstanding shares, and a 52 week range of CA$0.10 – 0.47.
[SMNLINSERT]
Important Disclosures:
1) James Guttman wrote this article for Streetwise Reports LLC and provides services to Streetwise Reports as an employee.
2) This article does not constitute investment advice and is not a solicitation for any investment. Streetwise Reports does not render general or specific investment advice and the information on Streetwise Reports should not be considered a recommendation to buy or sell any security. Each reader is encouraged to consult with his or her personal financial adviser and perform their own comprehensive investment research. By opening this page, each reader accepts and agrees to Streetwise Reports’ terms of use and full legal disclaimer. Streetwise Reports does not endorse or recommend the business, products, services or securities of any company.
For additional disclosures, please click here.

( Companies Mentioned: OMG:TSXV;OMGGF:OTC,
)
Categories
A Golden Gravy Train

Source: Stewart Thomson 03/28/2025
Newsletter writer Stewart Thomson addresses the question of a “Gold Bull Era” and a 40-year inflation and interest rate cycle.
Gold stocks rock!
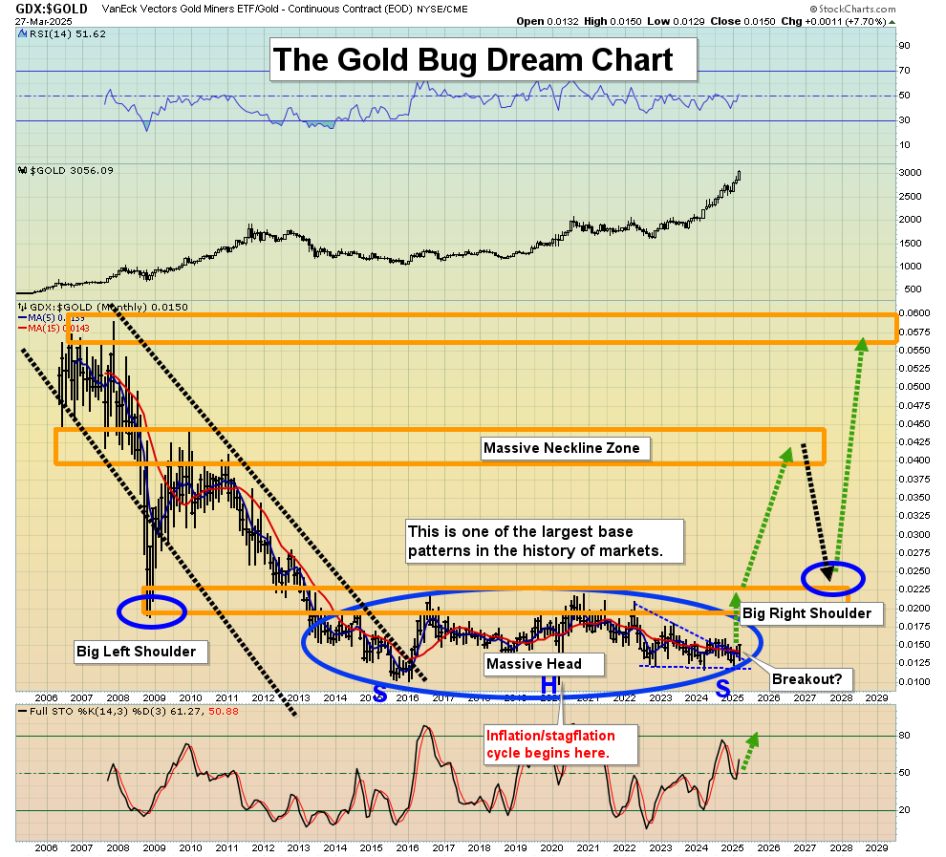
Here’s a look at one of the greatest charts in the history of markets, the gold stocks (GDX) versus gold chart. Note when the low occurred (early in the year 2020).
Then have a good look at this chart:
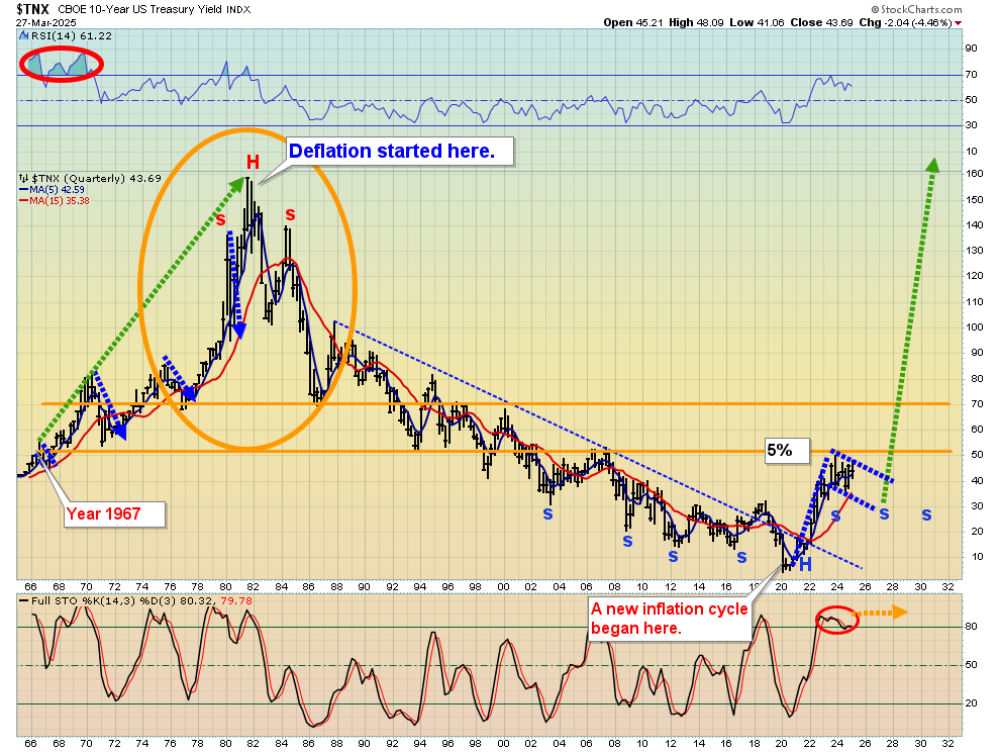
That’s the long-term U.S. rates chart . . . with the 40-year inflation/deflation cycle highlighted. The interest rates low occurred at the exact same time as the gold stocks versus gold bullion low occurred.
Here’s the bottom line: Gold stocks stage “flash in the pan” rallies during deflation cycles, like the 2009-2011 period, during the deflation cycle of 1980-2020 but. . .
For true big league moves higher, an inflationary cycle is required, and with it comes . . . much higher rates.
Here’s another stunning gold stocks chart:
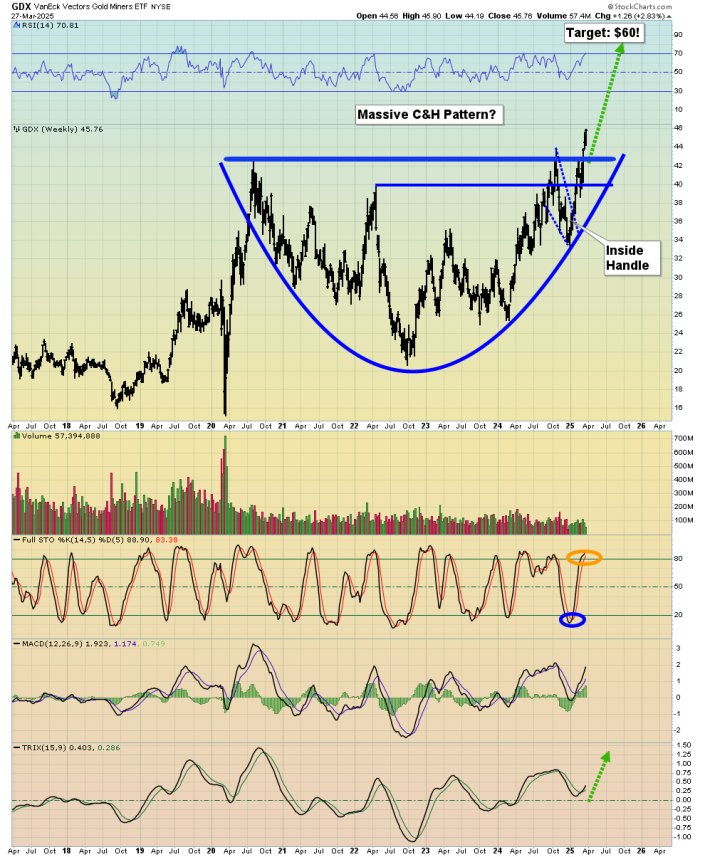
I urged investors to buy senior miners aggressively, basis the rare “inside handle” of this fabulous C&H (cup and handle) pattern.
It’s incredibly rare for the handle to be inside the cup . . . and incredibly bullish!
A lot of gold analysts have been caught flat-footed as the gold stocks surge relentlessly . . . and it’s happening while the U.S. stock market begins to incinerate in what is likely to become a “hybrid horror” of the 1929 and 1966 meltdown events repeating again.
Most sentiment indexes are technical indexes. They use moving averages, oscillators, etc., to describe sentiment, but they don’t always reflect a real investor’s mood.
Here’s a look at the BPGDM sentiment index for gold stocks:
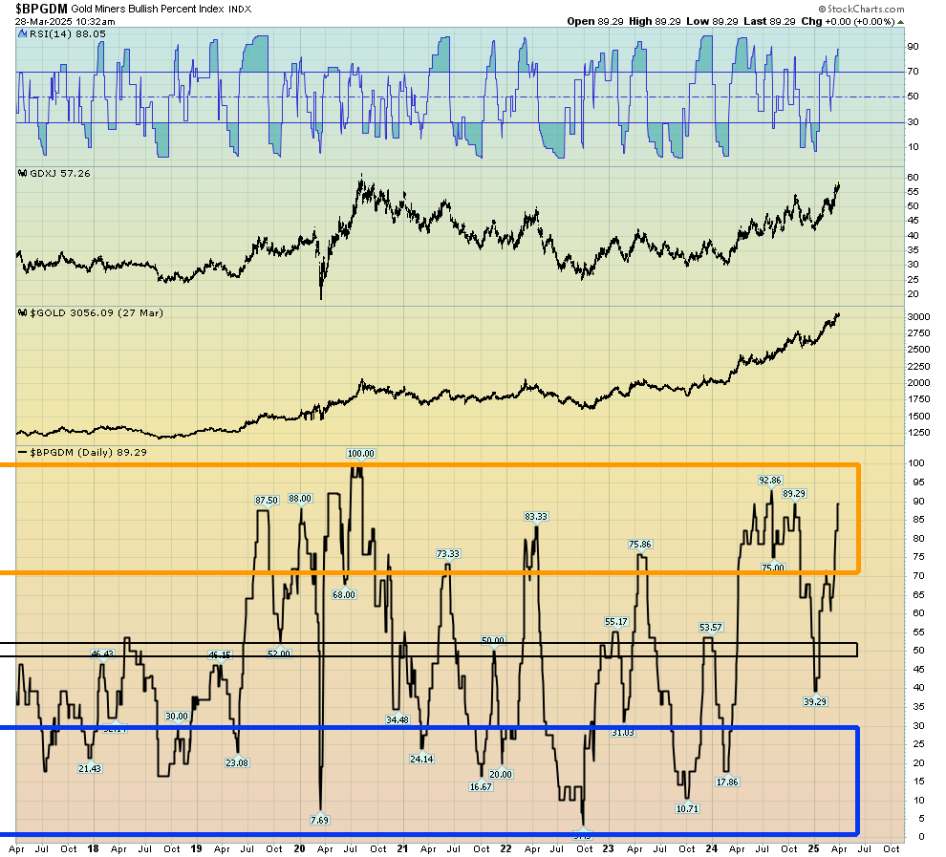
It has a “nosebleed,” but the average gold stock investor is not showing me any greed. In fact, many are as quiet as mice. That tells me that the $60 C&H pattern target for the GDX is likely only a “starter move,” and GDX is likely to trade above $100 before there’s anything resembling real greed in the market.
What about the juniors? Well, here’s a look at the CDNX daily chart:
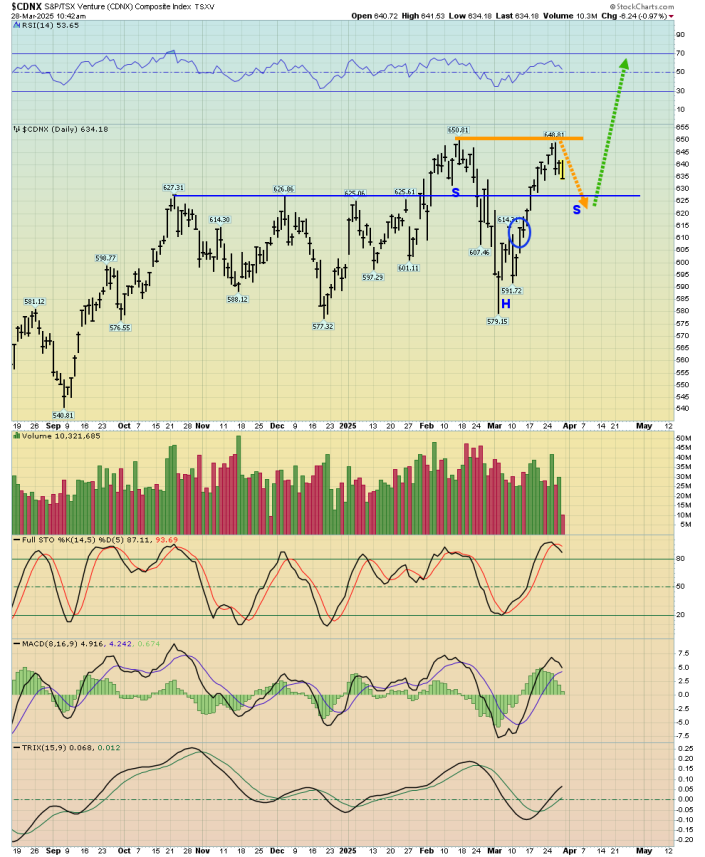
The chart is showcasing bullish technical action. Also, note that when gold dips, all senior miners dip too, almost without exception.
In contrast, when the CDNX takes a hit, there are many individual miners “marching to their own technical drummer.”
Here’s a look at one of them now:
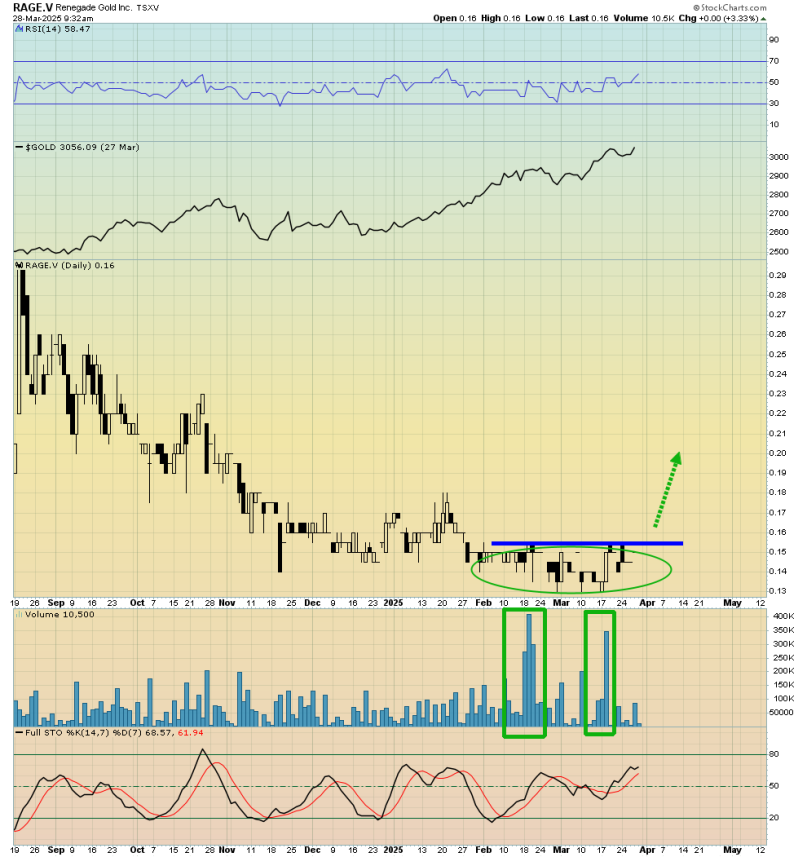
Renegade is working in the Red Lake area in Ontario. Note the recent jumps in volume, shown at the bottom of the chart. Gamblers could nibble at this stock with an optional mental stop at 12 cents.
Here’s a look at a potentially very big play:
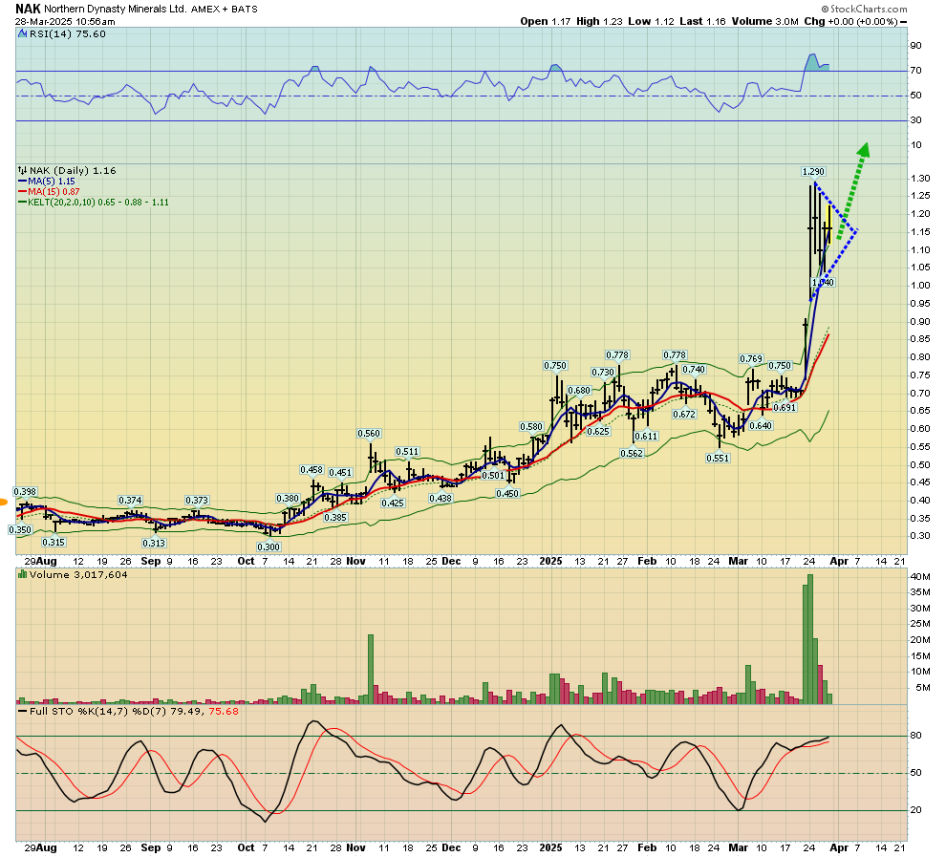
Northern Dynasty Minerals Ltd. (NDM:TSX; NAK:NYSE.MKT) has the world’s largest gold and copper resources, and there’s a bull pennant on this daily chart. Trump’s call to “Drill, baby, drill!” has oil company executives excited. Will “Mine, baby, mine!” be the next call to action from this administration? Maybe. The chart is certainly positive.
There will, of course, be setbacks for both the junior and senior miners in the coming days, weeks, and months . . . but gold bull and bear cycles are very long. This is a particularly interesting bull cycle because it involves empire transition, from a modestly populated and fiat-oriented West . . . to the massively populated gold-obsessed East.
Gold peaked at about $160 around the year 1869 and didn’t trade above there for 100 years. The bear cycle from 1980 to 2000 was very short, compared to most cycles for gold. The current cycle isn’t really a gold bull market as much as it’s a gold bull era . . . one that is likely to last at least 200 years. Gold stock investors, whether they know it or not, are riding what could be the biggest financial gravy train in the history of the world!
Special Offer for Streetwise Readers: Please send me an Email to freereports@galacticupdates.com and I’ll send my free “GDXJ, SGDJ, & Key Gold Stocks Play!” report. I highlight technical action in these ETFs, with five of the hottest stocks to buy. Key investor tactics are included in the report.
I write my junior resource stocks newsletter about twice a week, and at just $199/12mths it’s an investor favourite. I’m doing a special pricing this week of $169 for 14mths. Click this link or send me an email if you want the offer and I’ll get you onboard. Thank-you.
Sign up for our FREE newsletter at: www.streetwisereports.com/get-news
Important Disclosures:
- As of the date of this article, officers and/or employees of Streetwise Reports LLC (including members of their household) own securities of Northern Dynasty Minerals Ltd.
- Stewart Thomson: I, or members of my immediate household or family, own securities of: gold and GDX. I determined which companies would be included in this article based on my research and understanding of the sector.
- Statements and opinions expressed are the opinions of the author and not of Streetwise Reports, Street Smart, or their officers. The author is wholly responsible for the accuracy of the statements. Streetwise Reports was not paid by the author to publish or syndicate this article. Streetwise Reports requires contributing authors to disclose any shareholdings in, or economic relationships with, companies that they write about. Any disclosures from the author can be found below. Streetwise Reports relies upon the authors to accurately provide this information and Streetwise Reports has no means of verifying its accuracy.
- This article does not constitute investment advice and is not a solicitation for any investment. Streetwise Reports does not render general or specific investment advice and the information on Streetwise Reports should not be considered a recommendation to buy or sell any security. Each reader is encouraged to consult with his or her personal financial adviser and perform their own comprehensive investment research. By opening this page, each reader accepts and agrees to Streetwise Reports’ terms of use and full legal disclaimer. Streetwise Reports does not endorse or recommend the business, products, services or securities of any company.
For additional disclosures, please click here.
Stewart Thomson Disclosures
Stewart Thomson is no longer an investment advisor. The information provided by Stewart and Graceland Updates is for general information purposes only. Before taking any action on any investment, it is imperative that you consult with multiple properly licensed, experienced and qualified investment advisors and get numerous opinions before taking any action. Your minimum risk on any investment in the world is: 100% loss of all your money. You may be taking or preparing to take leveraged positions in investments and not know it, exposing yourself to unlimited risks. This is highly concerning if you are an investor in any derivatives products. There is an approx $700 trillion OTC Derivatives Iceberg with a tiny portion written off officially. The bottom line:
Are You Prepared?

( Companies Mentioned: NDM:TSX; NAK:NYSE.MKT,
)
Source: Robert Sinn 03/28/2025
Robert Sinn of Goldfinger looks at a recent Bank of American publication that highlights how, when it comes to gold, “American first” may lead to “America alone.”
Remember that November 2024 tale suggesting Trump’s second term would harm gold prices?
It claimed that tariffs might trigger a U.S. dollar short squeeze, while tariff-induced inflation would force the Fed to implement stricter monetary policies.
This story quickly faded, but gold certainly experienced a sharp bull-market retreat during the two weeks after the November 5 U.S. election:
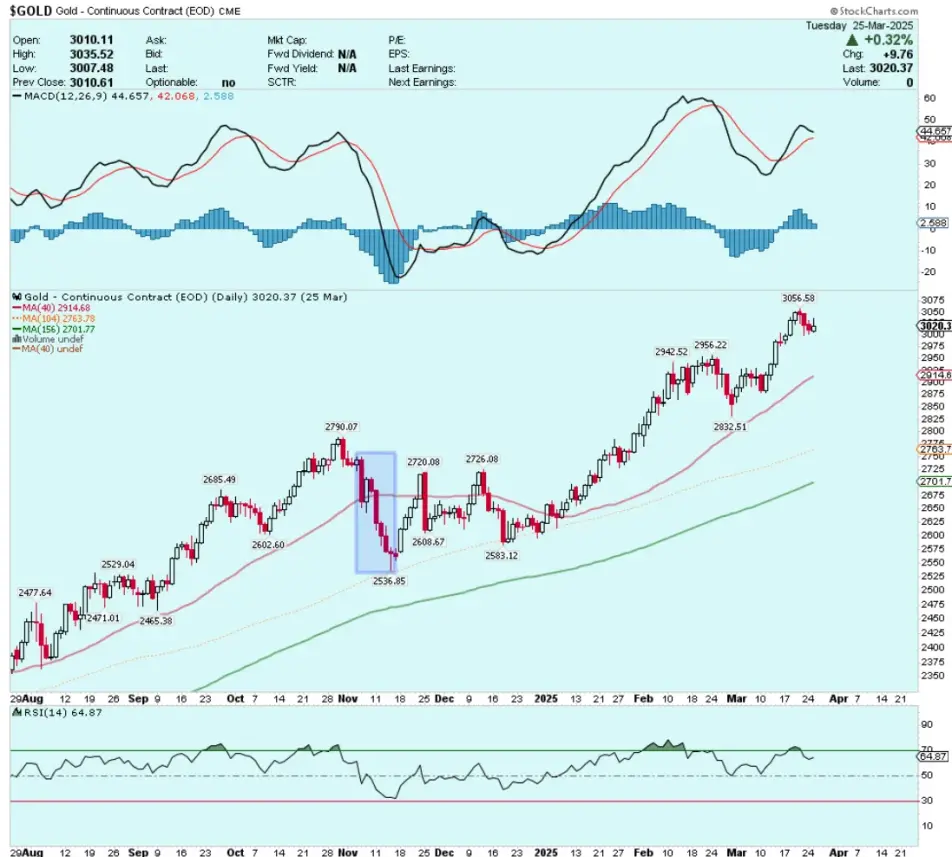
The Trump 2.0 gold pullback of November 2024 concluded on November 14 at $2,537/oz.
Gold has been climbing steadily since.
The U.S. dollar short squeeze did materialize briefly. However, it’s becoming increasingly evident that the Trump Administration aims to weaken the U.S. dollar to rebalance U.S. trade deficits. Meanwhile, the de-dollarization trend continues steadily.
Regarding tariff-driven inflation, Fed Chair Powell clarified during last week’s press conference that he considers inflation from tariffs as ‘temporary.’ He also stressed that the Fed is monitoring economic impacts from tariff uncertainty, ready to intervene if US employment conditions worsen. This suggests the Fed would more likely ease monetary policy due to tariff consequences.
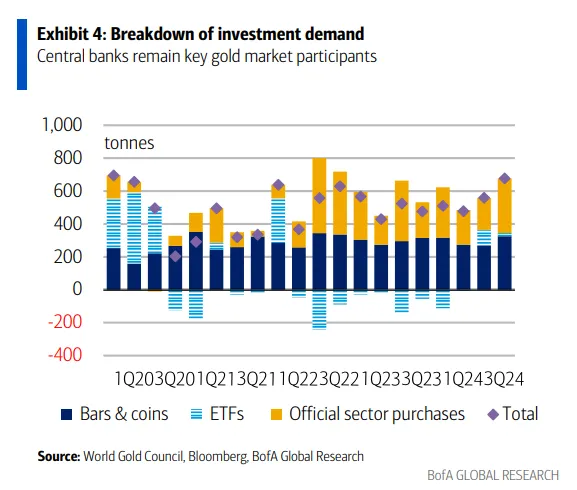
Bank of America recently released a comprehensive research paper titled “Gold plating guns and cannons.” The report outlined several positive catalysts for gold while also noting potential challenges to the optimistic gold outlook.
Positive demand drivers & economic factors boosting gold:
- China’s Insurance Sector: New regulations permit insurers to allocate up to 1% of their assets to gold, potentially adding 300 tonnes of gold purchases (6.5% of the annual physical market demand).
- Central Banks (CBs): Currently maintaining 10% of reserves in gold, CBs might increase to 30% for greater portfolio efficiency.
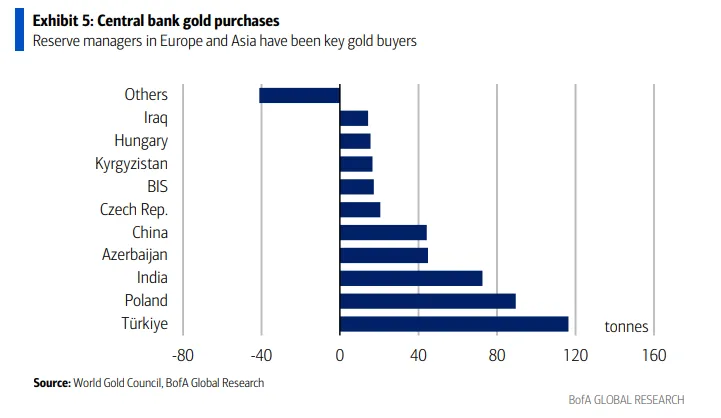
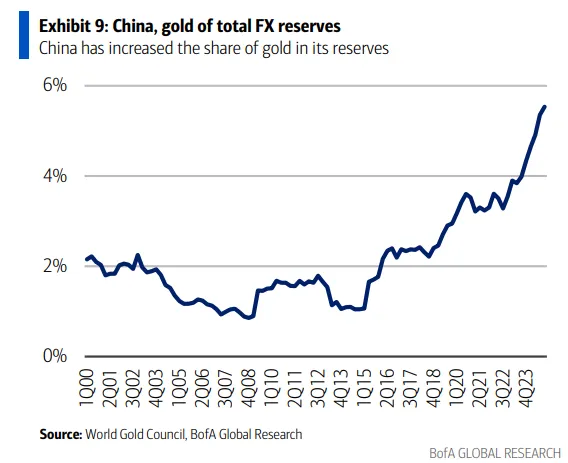
- China’s PBoC boosted its gold reserves to 5.5% of total FX reserves in Q4 2024; numerous central banks are actively cutting USD holdings in favor of gold.
- U.S. Economic Strategy: Ambiguity surrounding tariffs, trade policies, and fiscal gaps is stimulating demand for gold.
- U.S. Dollar Decline: A softer dollar supports gold prices, as global diversification away from USD holdings persists.
- Geopolitical Tensions: Intensifying trade frictions and global policy uncertainty are enhancing gold’s reputation as a safe-haven asset.
- Gold-backed ETFs witnessed 4% year/year expansion, reversing previous outflows. Retail investment continues to climb, especially in North America and Europe.
- Multi-Polar Landscape: The global shift from U.S.-led unipolar dominance to a multi-polar world heightens gold’s allure. If global CBs pivot away from USD holdings, gold will probably benefit as a reserve asset.
The blend of sustained global central bank gold acquisition, heightened retail investor enthusiasm in Europe and the U.S., and China’s insurance industry emerging as a substantially larger force in driving physical gold demand could push gold to $3,500 by mid-2026.
BofA identifies three primary threats to the bullish gold perspective:
- U.S. Fiscal Improvement: If the U.S. successfully shrinks deficits, it may dampen demand for gold.
- Robust USD & Interest Rate Increases: Higher real rates could diminish investor interest for gold.
- Enhanced Geopolitical Harmony: A return to stronger global cooperation could restrict gold’s appeal.
The second and third points seem unlikely scenarios. The likelihood of reduced U.S. fiscal deficits remains an unpredictable variable — judging by the U.S. government deficit forecasts for the current fiscal year, prospects appear dim:
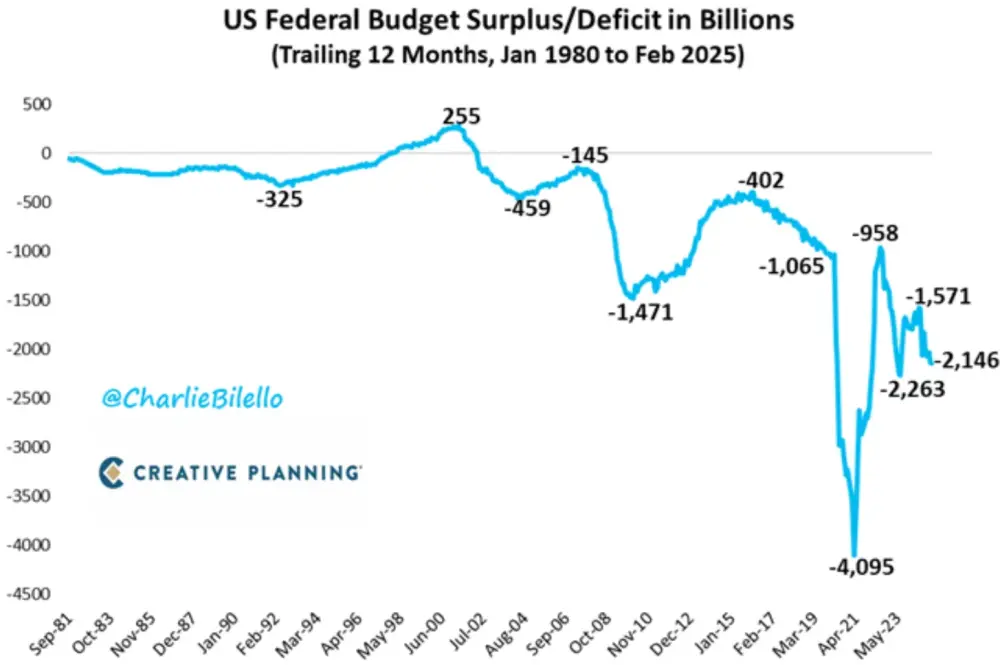
In February alone, the US government posted a $307 billion budget shortfall! That accumulates to a $2,150,000,000,000 deficit over the past 12 months.
Perhaps the most significant immediate threat to gold’s rally is the possibility of Trump retracting most tariff threats. While this doesn’t appear highly probable currently, if it happens, we might see stocks surge and Treasury yields climb. Potentially subjecting gold to selling pressure.
Ultimately, Trump 2.0’s “America First” approach might culminate in an “America Alone” outcome. By turning inward to address the twin deficits, the U.S. risks alienating trading partners and former allies. The possibility of U.S. withdrawal from NATO represents perhaps the most significant example of a potential “America Alone” scenario.
The consequence of growing American isolationism could be a further reduction of U.S.dollar holdings by foreign central banks and a weakened U.S. dollar. Gold stands to gain significantly in such circumstances.
Gold’s future looks promising.
Sign up for our FREE newsletter at: www.streetwisereports.com/get-news
Important Disclosures:
-
Statements and opinions expressed are the opinions of the author and not of Streetwise Reports, Street Smart, or their officers. The author is wholly responsible for the accuracy of the statements. Streetwise Reports was not paid by the author to publish or syndicate this article. Streetwise Reports requires contributing authors to disclose any shareholdings in, or economic relationships with, companies that they write about. Any disclosures from the author can be found below. Streetwise Reports relies upon the authors to accurately provide this information and Streetwise Reports has no means of verifying its accuracy.
- This article does not constitute investment advice and is not a solicitation for any investment. Streetwise Reports does not render general or specific investment advice and the information on Streetwise Reports should not be considered a recommendation to buy or sell any security. Each reader is encouraged to consult with his or her personal financial adviser and perform their own comprehensive investment research. By opening this page, each reader accepts and agrees to Streetwise Reports’ terms of use and full legal disclaimer. Streetwise Reports does not endorse or recommend the business, products, services or securities of any company.
For additional disclosures, please click here.
Robert Sinn Disclosures
The article is for informational purposes only and is neither a solicitation for the purchase of securities nor an offer of securities. Readers of the article are expressly cautioned to seek the advice of a registered investment advisor and other professional advisors, as applicable, regarding the appropriateness of investing in any securities or any investment strategies, including those discussed above. West Red Lake Gold Mines Ltd. is a high-risk venture stock and not suitable for most investors. Consult West Red Lake Gold Mines Ltd’s SEDAR profiles for important risk disclosures.
This article contains certain forward-looking information and forward-looking statements within the meaning of applicable securities legislation (collectively “forward-looking statements”). Certain information contained herein constitutes “forward-looking information” under Canadian securities legislation. Generally, forward-looking information can be identified by the use of forward-looking terminology such as “expects”, “believes”, “aims to”, “plans to” or “intends to” or variations of such words and phrases or statements that certain actions, events or results “will” occur. Forward-looking statements are based on the opinions and estimates of management as of the date such statements are made and they are subject to known and unknown risks, uncertainties and other factors that may cause the actual results, level of activity, performance or achievements of the Company to be materially different from those expressed by such forward-looking statements or forward-looking information, standard transaction risks; impact of the transaction on the parties; and risks relating to financings; regulatory approvals; foreign country operations and volatile share prices. Although management of the Company has attempted to identify important factors that could cause actual results to differ materially from those contained in forward-looking statements or forward-looking information, there may be other factors that cause results not to be as anticipated, estimated or intended. There can be no assurance that such statements will prove to be accurate, as actual results and future events could differ materially from those anticipated in such statements. Actual results may differ materially from those currently anticipated in such statements. Accordingly, readers should not place undue reliance on forward-looking statements and forward looking information. The Company does not undertake to update any forward-looking statements or forward-looking information that are incorporated by reference herein, except as required by applicable securities laws. Always thoroughly do your own due diligence and talk to a licensed investment adviser prior to making any investment decisions. Junior resource companies can easily lose 100% of their value so read company profiles on www.sedarplus.ca for important risk disclosures. It’s your money and your responsibility.

Categories
Co. Announces New Dividend, Q4/24 Results
Source: Don DeMarco 03/28/2025
The monies received from its joint venture project allow the producer to return cash to its shareholders, the National Bank of Canada noted.
MAG Silver Corp. (MAG:TSX; MAG:NYSE American) released its new “best-in-class silver dividend” policy and its Q4/24 financial results, reported Don DeMarco, National Bank of Canada (NBC) analyst, in a March 24 research note.
“[The] inaugural dividend with cash flow-linked feature allows investors [to] get paid with a yield that’s among the top for silver names while maintaining upside to silver prices,” DeMarco wrote.
30% Implied Uplift
The analyst reported that on the news, NBC reiterated its CA$30.50 per share (CA$30.50/share) target price on the Canadian silver producer.
“Our thesis considers production growth at Juanicipio (44%), diversified metal production, a rerate to producer multiples, exploration upside, and mergers and acquisitions appeal tempered by Juanicipio joint venture (JV) terms, which limit profit sharing to once per year,” wrote DeMarco. Juanicipio is MAG’s joint venture project in Mexico with Fresnillo Plc (FNLPF:OTCMKTS:FRES:LSE).
MAG’s share price at the time of the report was about CA$23.43, noted DeMarco. The suggested potential return is 30%.
The rating on the company remains Outperform.
Two-Part Dividend
DeMarco reviewed the details of MAG’s new dividend. Its first one, payable in Q2/25, will be US$0.18/share. This will consist of a US$0.02/share fixed dividend and a US$0.16/share variable dividend linked to 30% cash flow from Juanicipio.
This dividend, according to management, represents an annualized yield of about 3.2%, which is among the top yields for silver names and comes from a long-life asset with exploration upside.
The cash distribution and dividend the JV pays to MAG will enable the latter to start and continue issuing a dividend to shareholders, wrote DeMarco. At the end of Q4/24, the JV had US$53.2M in cash and cash equivalents, about $43.6M less than $96.8M in Q3/24.
Corporate Financials
DeMarco presented Q4/24 financial and operational results for MAG and Juanicipio.
MAG’s Q4/24 earnings per share was US$0.18, which was US$0.05 and US$0.03 lower than NBC and consensus’ estimates, respectively. This was due to nonoperating items and higher JV taxes, which led to lower equity income for the company.
Silver production attributable to MAG was 4,300,000 ounces (4.3 Moz). Sales were down quarter over quarter, totaling 3.9 Moz versus 4.5 Moz.
MAG, at the end of Q4/24, had US$162.3M in cash and cash equivalents. Free cash flow was US$48.8M versus ($19.1M). During the quarter, the producer’s 44% of the Juanicipio shareholder loans was reduced to US$4.7M from US$29.2M in Q3/24.
Total cash costs net of byproducts was US$0.05/oz silver, lower than NBC’s estimate but higher QOQ. All-in sustaining cost was US$8.71/oz silver, higher than NBC’s forecast and higher quarter over quarter (QOQ).
Juanicipio Results Only
In Q4/24, free cash flow was US$78.9M, down US$17.9M from US$95.5M in Q3/24.
Free cash flow was lower QOQ due to higher capex QOQ, offsetting cash flow from operating activities (CFO) that is still elevated despite higher costs QOQ. Q4/24 CFO was US$111.6M versus US$109.8M in Q3/24.
What to Watch For
MAG is finishing its analysis of data from its 2024 exploration work, from which it will identify new targets. The company is to resume drilling in H2/25.
Sign up for our FREE newsletter at: www.streetwisereports.com/get-news
Important Disclosures:
- MAG Silver Corp. is a billboard sponsor of Streetwise Reports and pays SWR a monthly sponsorship fee between US$4,000 and US$5,000.
- Doresa Banning wrote this article for Streetwise Reports LLC and provides services to Streetwise Reports as an independent contractor.
- This article does not constitute investment advice and is not a solicitation for any investment. Streetwise Reports does not render general or specific investment advice and the information on Streetwise Reports should not be considered a recommendation to buy or sell any security. Each reader is encouraged to consult with his or her personal financial adviser and perform their own comprehensive investment research. By opening this page, each reader accepts and agrees to Streetwise Reports’ terms of use and full legal disclaimer. Streetwise Reports does not endorse or recommend the business, products, services or securities of any company.
For additional disclosures, please click here.
Disclosures for National Bank, MAG Silver Corp., March 24, 2025
RISKS: Non-Operator: MAG’s primary asset is the Juanicipio property (44%) being developed in partnership with Fresnillo Plc (56%). As a non-operator, MAG does not directly control the future production or development of the asset and any delays in the forecasted production schedule could negatively impact revenue and indirectly impact the valuation of the company. Financing & Liquidity Risk: MAG is responsible for its share of development capex for Juanicipio. Post-development of the Juanicipio property, MAG will be exposed to risks related to fluctuating silver, gold, zinc, lead and fuel/power prices. ADDITIONAL COMPANY RELATED DISCLOSURES MAG Silver Corp. Aya Gold & Silver Inc. First Majestic Silver Corp. Pan American Silver Corp. 2, 3, 5, 7 LEGEND FOR COMPANY RELATED DISCLOSURES: 2 National Bank Financial Inc. has acted as an underwriter with respect to this issuer within the past 12 months. 3 National Bank Financial Inc. has provided investment banking services for this issuer within the past 12 months. 4 National Bank Financial Inc. or an affiliate has managed or co-managed a public offering of securities with respect to this issuer within the past 12 months. 5 National Bank Financial Inc. or an affiliate has received compensation for investment banking services from this issuer within the past 12 months. 6 National Bank Financial Inc. or an affiliate has a non-investment banking services related relationship during the past 12 months. 7 The issuer is a client, or was a client, of National Bank Financial Inc. or an affiliate within the past 12 months. 8 National Bank Financial Inc. or its affiliates expects to receive or intends to seek compensation for investment banking services from this issuer in the next 3 months. 9 As of the end of the month immediately preceding the date of publication of this research report (or the end of the second most recent month if the publication date is less than 10 calendar days after the end of the most recent month), National Bank Financial Inc. or an affiliate beneficially own 1% or more of any class of common equity securities of this issuer. 10 National Bank Financial Inc. makes a market in the securities of this issuer, at the time of this report publication. 11 A partner, director, officer or research analyst involved in the preparation of this report has, during the preceding 12 months provided services to this issuer for remuneration other than normal course investment advisory or trade execution services. 12 A research analyst, associate or any other person (or a member of their household) directly involved in preparing this report has a financial interest in the securities of this issuer. 13 A partner, director, officer, employee or agent of National Bank Financial Inc., is an officer, director, employee of, or serves in any advisory capacity to the issuer. 14 A member of the Board of Directors of National Bank Financial Inc. is also a member of the Board of Directors or is an officer of this issuer. 15 A redacted draft version of this report has been shown to the issuer for fact checking purposes and changes may have been made to the report before publication.
DISCLOSURES GENERAL: This Report was prepared by National Bank Financial Inc. (NBF), a Canadian investment dealer, a dealer member of the Canadian Investment Regulatory Organization (CIRO) and an indirect wholly owned subsidiary of National Bank of Canada. National Bank of Canada is a public company listed on the Toronto Stock Exchange. The particulars contained herein were obtained from sources which we believe to be reliable but are not guaranteed by us and may be incomplete and may be subject to change without notice. The information is current as of the date of this document. Neither the author nor NBF assumes any obligation to update the information or advise on further developments relating to the topics or securities discussed. The opinions expressed are not to be construed as a solicitation or offer to buy or sell the securities mentioned herein, and nothing in this report constitutes a representation that any investment strategy or recommendation contained herein is suitable or appropriate to a recipient’s individual circumstances. In all cases, investors should conduct their own investigation and analysis of such information before taking or omitting to take any action in relation to securities or markets that are analyzed in this report. The report alone is not intended to form the basis for an investment decision, or to replace any due diligence or analytical work required by you or your advisers, if needed, in making an investment decision. The value of investments, and the income derived from them, can go down as well as up and you may not get back the amount invested. Neither past performance nor forecasts are a reliable guide to future performance. If an investment is denominated in a foreign currency, rates of exchange may have an adverse effect on the value of the investment. Investments which are illiquid may be difficult to sell or realize; it may also be difficult to obtain reliable information about their value or the extent of the risks to which they are exposed. Certain transactions, including those involving futures, swaps, and other derivatives, give rise to substantial risk and are not suitable for all investors. NBF makes no representation as to the proper characterization of the investments for legal, regulatory or tax purposes, or as to the ability of a particular investor to invest or transact in the investments under applicable legal restrictions. Differences in the legal and regulatory regimes in different jurisdictions may significantly impact the legal and regulatory risks affecting the investment sector and / or investment. It is your responsibility to assess any such differences and associated risks. This report is for distribution only under such circumstances as may be permitted by applicable law. This report is not directed at you if NBF or any affiliate distributing this report is prohibited or restricted by any legislation or regulation in any jurisdiction from making it available to you. National Bank of Canada Financial Markets is a trade name used by National Bank Financial Inc. and National Bank of Canada Financial Inc. CANADIAN RESIDENTS: NBF or its affiliates may engage in any trading strategies described herein for their own account or on a discretionary basis on behalf of certain clients and, as market conditions change, may amend or change investment strategy including full and complete divestment. The trading interests of NBF and its affiliates may also be contrary to any opinions expressed in this report. NBF or its affiliates often act as financial advisor, agent, lender or underwriter or provides trading related services for certain issuers mentioned herein and may receive remuneration for its services. NBF is a member of the Canadian Investor Protection Fund. UK RESIDENTS: This report is a marketing document. This report has not been prepared in accordance with legal requirements designed to promote the independence of investment research and it is not subject to any prohibition on dealing ahead of the dissemination of investment research. The report is only for distribution to Eligible Counterparties and Professional Clients in the United Kingdom within the meaning of the rules of the Financial Conduct Authority (FCA). The investments contained in this report are not available to retail customers and this report is not for distribution to retail clients (within the meaning of the rules of the FCA). Persons who are retail clients should not act or rely upon the information in this report. As required by the FCA, we have a policy in place to identify and manage the conflicts of interest which may arise in the production of non-independent research as contained and distributed in this report. In respect of the distribution of this report to UK residents, NBF has approved the contents (including, where necessary, for the purposes of Section 21(1) of the Financial Services and Markets Act 2000). NBF is authorized and regulated by the Financial Conduct Authority with registration number FC009503 and has its registered office at 70 St. Mary Axe, London, EC3A 8BE. U.S. RESIDENTS: With respect to the distribution of this report in the United States of America (the U.S.), National Bank of Canada Financial Inc. (NBCFI) is registered with the Securities Exchange Commission (SEC) as a broker-dealer and is a member of the Financial Industry Regulatory Authority (FINRA) and the Securities Investor Protection Corporation (SIPC). NBCFI operates pursuant to a 15 a-6 Agreement with its Canadian affiliates, NBF and National Bank of Canada. NatWealth Management (USA) Inc. (NatWealth) is a SEC-registered investment adviser.
This report has been prepared in whole or in part by research analysts employed by non-U.S. affiliates of NBCFI that are not registered as broker-dealers or investment advisers in the U.S. These nonU.S. research analysts are not registered as associated persons of NBCFI and are not licensed or qualified as research analysts with FINRA or any other U.S. regulatory authority and, accordingly, may not be subject (among other things) to FINRA restrictions regarding communications by a research analyst with the subject company, public appearances by research analysts and trading securities held in a research analyst account. NBF is a Participating Affiliate of NatWealth, and as such each research analyst who provides services to that constitute acting as an investment adviser under U.S. law and regulation is deemed an associated person of NatWealth as part of the participating affiliate regime established by SEC Staff no-action letters. If you make “hard dollar” payments in respect of NBF research services, then such services, including this report, are provided to you by NatWealth under the U.S. Investment Advisers Act of 1940 (the Advisers Act). If you do not make “hard dollar” payments in respect of NBF research services, then such services, including this report, are provided to you via intermediation of NBCFI under Rule 15a-6, and are not subject to the Advisers Act. Because the views of research analysts may differ, members of NBF Group may have or may in the future issue reports that are inconsistent with this report, or that reach conclusions different from those in this report. To make further inquiry related to this report, U.S. residents should contact their NBCFI registered representative or NatWealth associated person, as applicable. HK RESIDENTS: With respect to the distribution of this report in Hong Kong by NBC Financial Markets Asia Limited (NBCFMA) which is licensed by the Securities and Futures Commission (SFC) to conduct Type 1 (dealing in securities) and Type 3 (leveraged foreign exchange trading) regulated activities, the contents of this report are solely for informational purposes. It has not been approved by, reviewed by, verified by or filed with any regulator in Hong Kong. Nothing herein is a recommendation, advice, offer or solicitation to buy or sell a product or service, nor an official confirmation of any transaction. None of the products issuers, NBCFMA or its affiliates or other persons or entities named herein are obliged to notify you of changes to any information and none of the foregoing assume any loss suffered by you in reliance of such information. The content of this report may contain information about investment products which are not authorized by SFC for offering to the public in Hong Kong and such information will only be available to those persons who are Professional Investors (as defined in the Securities and Futures Ordinance of Hong Kong (SFO)). If you are in any doubt as to your status you should consult a financial adviser or contact us. This material is not meant to be marketing materials and is not intended for public distribution. Please note that neither this material nor the product referred to is authorized for sale by SFC. Please refer to product prospectus for full details. There may be conflicts of interest relating to NBCFMA or its affiliates’ businesses. These activities and interests include potential multiple advisory, transactional and financial and other interests in securities and instruments that may be purchased or sold by NBCFMA or its affiliates, or in other investment vehicles which are managed by NBCFMA or its affiliates that may purchase or sell such securities and instruments. No other entity within the National Bank of Canada group, including National Bank of Canada and National Bank Financial Inc., is licensed or registered with the SFC. Accordingly, such entities and their employees are not permitted and do not intend to: (i) carry on a business in any regulated activity in Hong Kong; (ii) hold themselves out as carrying on a business in any regulated activity in Hong Kong; or (iii) actively market their services to the Hong Kong public. EU RESIDENTS: With respect to the distribution of this report in the member states of the European Union (EU) and the European Economic Area (EEA) by NBC Paris, the contents of this report are for information purposes only and do not constitute investment advice, investment research, financial analysis or other forms of general recommendation relating to transactions in financial instruments within the meaning of Directive 2014/65/EU of the European Parliament and of the Council of 15 May 2014 (MiFID 2). This report is intended only for professional investors and eligible counterparties within the meaning of MiFID 2 and its contents have not been reviewed or approved by any EU/EEA authority. NBC Paris is an investment firm authorized by the French Prudential Control and Resolution Authority (ACPR) to provide investment services in France and has passported its investment services throughout the EU/EEA under the freedom to provide services and has its registered office at 8 avenue Percier, 75008 Paris, France. “NBC Financial Markets, a subsidiary of National Bank of Canada” is a trade name used by NBC Paris S.A. NBF is not authorized to provide investment services in the EU/EEA COPYRIGHT: This Report may not be reproduced in whole or in part, or further distributed or published or referred to in any manner whatsoever, nor may the information, opinions or conclusions contained in it be referred to without in each case the prior express written consent of NBF. RESEARCH ANALYSTS: All of the views expressed in this research report accurately reflect the research analyst’s personal views regarding any and all of the subject securities or issuers. No part of the analyst’s compensation was, is, or will be, directly or indirectly, related to the specific recommendations or views expressed in this research report. The analyst responsible for the production of this report certifies that the views expressed herein reflect his or her accurate personal and technical judgment at the moment of publication. NBF compensates its research analysts from a variety of sources. The Research Department is a cost centre and is funded by the business activities of NBF including Institutional Equity Sales and Trading, Retail Sales, the correspondent clearing business, and Corporate and Investment Banking. Since the revenues from these businesses vary, the funds for research compensation vary. No one business line has a greater influence than any other for research analyst compensation. Ratings And What They Mean: PRIMARY STOCK RATING: NBF has a three-tiered rating system that is relative to the coverage universe of the particular analyst. Here is a brief description of each: Outperform (OP) – The stock is expected to outperform the analyst’s coverage universe over the next 12 months; Sector Perform (SP) – The stock is projected to perform in line with the sector over the next 12 months; Underperform (UP) – The stock is expected to underperform the sector over the next 12 months. SECONDARY STOCK RATING: Under Review (UR) − Our analyst has withdrawn the rating because of insufficient information and is awaiting more information and/or clarification; Tender (T) − Our analyst is recommending that investors tender to a specific offering for the company’s stock; Restricted (R) − Because of ongoing investment banking transactions or because of other circumstances, NBF policy and/or laws or regulations preclude our analyst from rating a company’s stock. INDUSTRY RATING: NBF has an Industry Weighting system that reflects the view of our Economics & Strategy Group, using its sector rotation strategy. The three-tiered system rates industries as Overweight, Market Weight and Underweight, depending on the sector’s projected performance against broader market averages over the next 12 months. RISK RATING: As of June 30, 2020, National Bank Financial discontinued its Below Average, Average and Above Average risk ratings. We continue to use the Speculative risk rating which reflects higher financial and/or operational risk. DISSEMINATION POLICY: Please click on this link to access NBF’s Research Dissemination Policy. COMPANY RELATED DISCLOSURES: Please click on this link to access Company Related Disclosures

( Companies Mentioned: MAG:TSX; MAG:NYSE American,
)
Categories
Copper Co. Should Be Up Way Higher

Source: Michael Ballanger 03/28/2025
Michael Ballanger shares his view on the current state of the market and comments on the price of one of his favorite copper stocks.
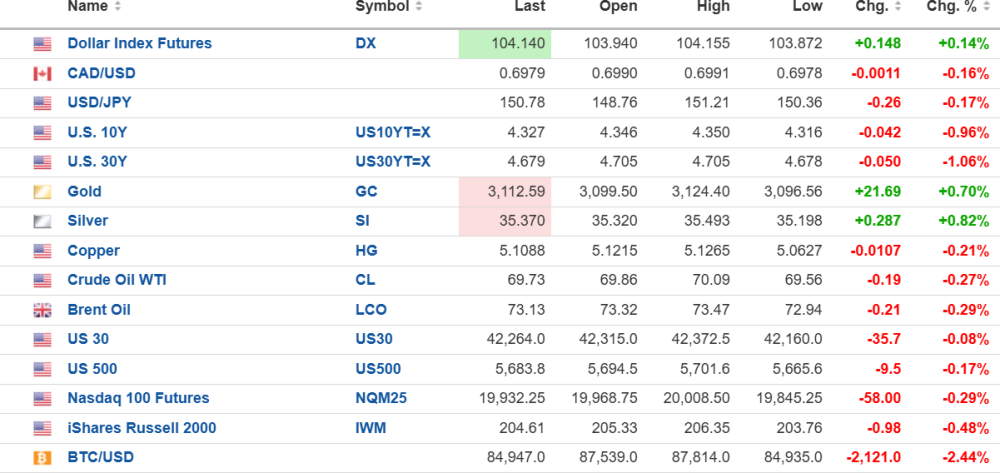
The U.S. dollar index futures (+0.19%) are up to 104.14, with the 10-year yield down 0.96%) to 4.327% and the 30-year yield down 1.06% to 4.679%.
Gold (+0.70%) and silver (-0.82% ) are higher, but copper (-0.21%) and oil (-0.27%) are down.
Risk barometer Bitcoin is down 2.44% to $84,947, returning again to bear market territory, down 22.3% from the top.
Metals
Gold and silver are responding to a big hedge book blow-up by Aussie gold miner Belleview Gold, whose 150k-ounce hedge with Macquarie Bank has forced them to market with an offering priced at an 80% discount to recent market prices. Silver has once again done its best to confuse and confound by vaulting to new highs above that US$35.07/oz breakout level that faked me out a week ago with embarrassing acuity.
If silver holds this level for the weekly close above the BO point, then I will be forced kicking hard and screaming bloody murder to take another run at silver calls. For now, because I am traveling, I will refrain from launching an open position, but subscribers can certainly consider it.
Copper is coming off an overbought condition so as long as it gold $4.95/lb. basis May futures, I will remain bullish. If the monthly close is above $5.00, it is yet another superb technical indication that $6-8 copper is on the immediate horizon.
Stocks
President Trump once again skewered the stock market recovery by imposing 25% tariffs on all foreign auto imports, sending the S&P into another dive yesterday.
These are the kind of absurd gyrations we are forced to accept with this constant barrage of Tweets and Executive Orders that are putting the market in a constant state of uncertainty. Traders are not in the habit of leveraging up in markets like these, so rallies are there “to be sold” with the SPY:US an outright short at the 50-dma around $570.66.
Fitzroy Minerals Inc.
I surfaced from a very long day of travel landing at Heathrow at 8:00 am followed by six hours of missed cutoffs and unbearably narrow “Roman roads” finally arriving in Cornwall about three hours after the markets opened. I was able to follow the trading in Fitzroy Minerals Inc. (FTZ:TSX.V; FTZFF:OTCQB) after they reported 43m of 2.31% copper with a 1.4m share day but a late-day fade after these moronic traders elected to “sell the news” taking it down from CA$0.39 to CA$0.32 in the last two hours.
I have to shake my head in belief when I told everyone that would listen that those results on their first Caballos drill hole were in every sense of the words “spectacular” and as CEO Merlin Marr-Johnson said “This remarkable intercept from our very first hole at Caballos identifies the potential of a new and significant copper-molybdenum-gold-rhenium system.”
I had calls from literally everyone in my book of mining contacts with accolade after accolade as congratulations piled in through email and text messages. In fact, one former corporate client said that the release was one of the best he had ever read for junior and that he was delighted to be able to ADD TO HIS POSITION into the pullback.
What infuriated me was that I had tweeted out the results from Fitzroy Minerals Inc. (FTZ:TSX.V; FTZFF:OTCQB) from October 2023 where they reported 45m of 1.9% copper, and then watched their stock go from CA$0.15 to CA$1.62 in the next month peaking at a market cap of $416 million.
FTZ/FTZFF reported 42m of 2.31% copper and peaked yesterday at a CA$86m market cap. Even more maddening is that BIG.V is a “one-project wonder” whereas FTZ/FTZFF has three additional projects including Buen Retiro (expected to close next week) giving them three fully-funded projects providing copious news flow for the balance of 2025.
Needless to say, I am a buyer of more stock, and I am looking into any additional weakness. I urge all subscribers to follow me. I will cross my fingers and try to add in the CA$0.28-CA$0.32 range with the undeterrable conviction that FTZ/FTZFF will be gone within twelve months at levels far higher than yesterday’s CA$0.39 high.
Add to FTZ/FTZFF. More news is pending next week, with drilling to recommence at Caballos shortly.
Sign up for our FREE newsletter at: www.streetwisereports.com/get-news
Important Disclosures:
- As of the date of this article, officers and/or employees of Streetwise Reports LLC (including members of their household) own securities of Fitzroy Minerals Inc.
- Michael Ballanger: I, or members of my immediate household or family, own securities of: Fitzroy Minerals Inc. My company has a financial relationship with Fitzroy Minerals Inc. I determined which companies would be included in this article based on my research and understanding of the sector.
- Statements and opinions expressed are the opinions of the author and not of Streetwise Reports, Street Smart, or their officers. The author is wholly responsible for the accuracy of the statements. Streetwise Reports was not paid by the author to publish or syndicate this article. Streetwise Reports requires contributing authors to disclose any shareholdings in, or economic relationships with, companies that they write about. Any disclosures from the author can be found below. Streetwise Reports relies upon the authors to accurately provide this information and Streetwise Reports has no means of verifying its accuracy.
- This article does not constitute investment advice and is not a solicitation for any investment. Streetwise Reports does not render general or specific investment advice and the information on Streetwise Reports should not be considered a recommendation to buy or sell any security. Each reader is encouraged to consult with his or her personal financial adviser and perform their own comprehensive investment research. By opening this page, each reader accepts and agrees to Streetwise Reports’ terms of use and full legal disclaimer. Streetwise Reports does not endorse or recommend the business, products, services or securities of any company.
For additional disclosures, please click here.
Michael Ballanger Disclosures
This letter makes no guarantee or warranty on the accuracy or completeness of the data provided. Nothing contained herein is intended or shall be deemed to be investment advice, implied or otherwise. This letter represents my views and replicates trades that I am making but nothing more than that. Always consult your registered advisor to assist you with your investments. I accept no liability for any loss arising from the use of the data contained on this letter. Options and junior mining stocks contain a high level of risk that may result in the loss of part or all invested capital and therefore are suitable for experienced and professional investors and traders only. One should be familiar with the risks involved in junior mining and options trading and we recommend consulting a financial adviser if you feel you do not understand the risks involved.

( Companies Mentioned: FTZ:TSX.V; FTZFF:OTCQB,
)