Should We Compare Bitcoin to Gold? Lessons From the Last Financial Crisis Knowledge@Wharton
Category: Gold
White House Says Gold Reserves May Be Used to Purchase Bitcoin Yahoo Finance
No charges for two men with $250K in gold bars found during traffic stop, but North Texas authorities will keep their gold WFAA.com

Source: John Newell 03/25/2025
John Newell of John Newell & Associates explains why he believes we are at a critical inflection point with gold. Newell also shares two gold companies he believes are worth looking into.
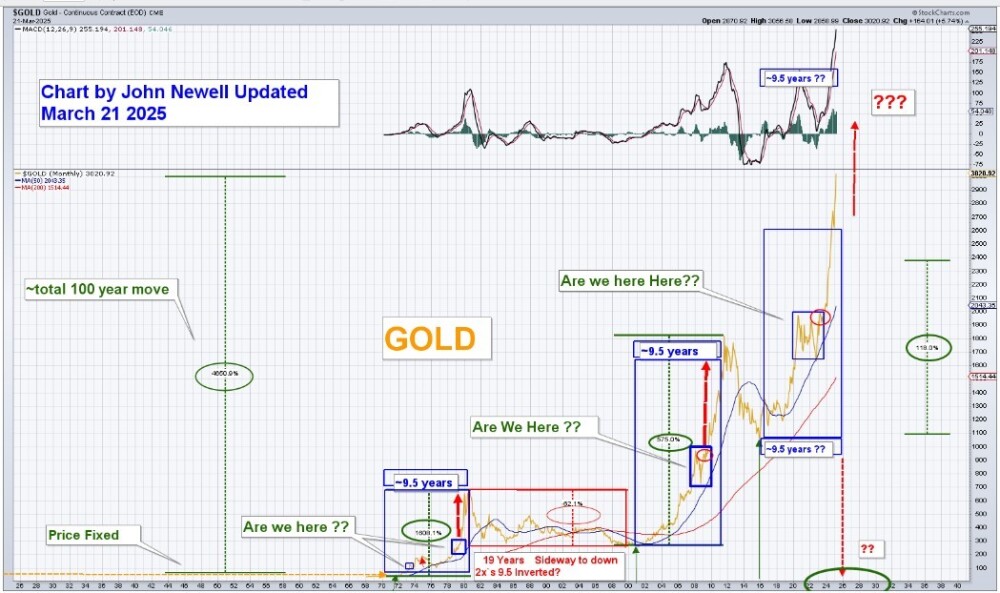
For the past 25 years, we have tracked the Dow/Gold ratio with obsessive precision. It’s been my North Star through multiple economic cycles, helping me see through the noise and anticipate turning points in the markets. We maintain a chart that goes back a full century, and it’s been flashing a signal I haven’t seen in a generation.
We are now at a critical inflection point, perhaps the most important since the 1970s. Gold is breaking out to all-time highs. The U.S. dollar is weakening. Meanwhile, gold equities, especially juniors, are trading at some of the most attractive valuations in history. These dislocations rarely last, and when they resolve, they do so violently.
This time, the setup is even more dramatic than in previous cycles. What we’re witnessing is the early stage of what may become the greatest wealth-building opportunity in 50 years.
We are witnessing a battle of historic proportions between two dominant forces: the Dow Jones Industrial Average and physical gold.
The outcome will determine where capital flows, and where fortunes are made, in the years ahead. This is the Battle of the Breakout.
Dow-to-Gold Ratio: A 100-Year Perspective
One of the most important charts to study right now is the Dow / Gold ratio. Historically, this ratio has served as a compass for capital allocation between paper assets and hard money. In 2000, it took 44 ounces of gold to buy a single Dow share. That number collapsed to just 6 ounces in 2011, during the last great gold bull. Today, it takes around 13 ounces. But what’s more important than the level is the structure. The chart is forming a textbook pennant formation, tightening into a point of resolution. This kind of pattern doesn’t drift sideways forever. It breaks. And when it breaks, it runs.
We’ve seen this play out before. In the 1970s, the Dow / Gold ratio fell 96%. In the 2000s, it fell 85%. Both collapses preceded enormous outperformance in gold and precious metals equities. Today’s setup is no different, except it may be even more explosive, due to the extreme levels of global debt, monetary distortion, and geopolitical uncertainty.
In 1980, it took just one ounce of gold to buy one entire Dow share. In 2011, it was six. Could we return to those levels again? The pattern suggests we can, and we will.
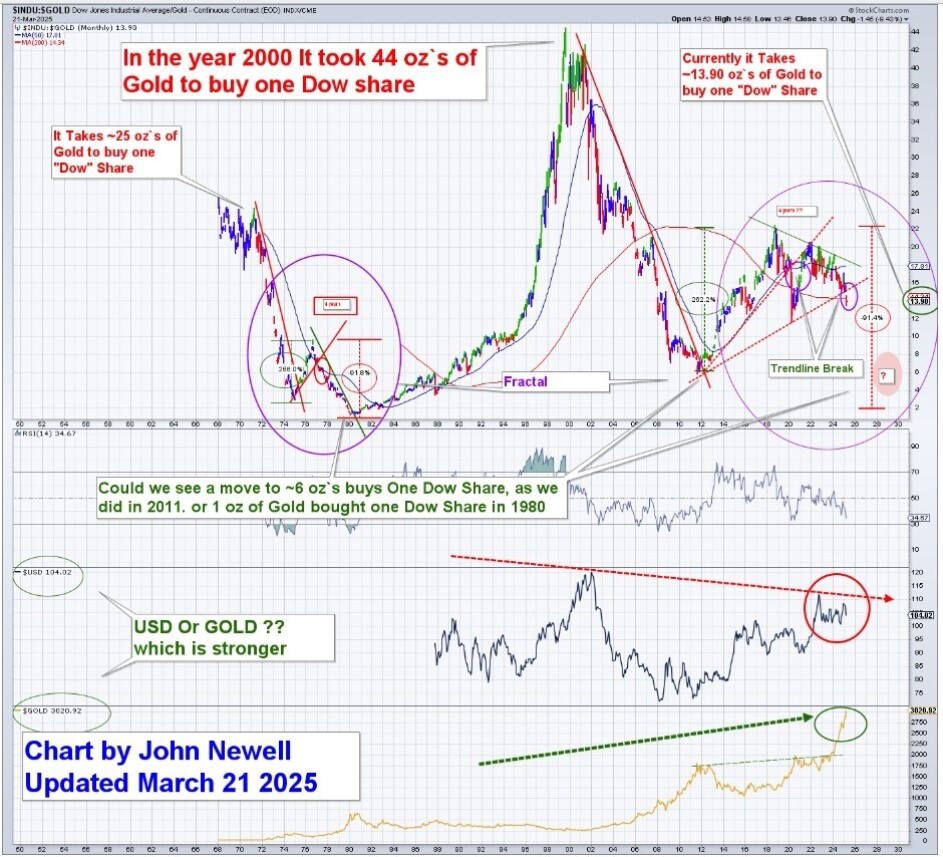
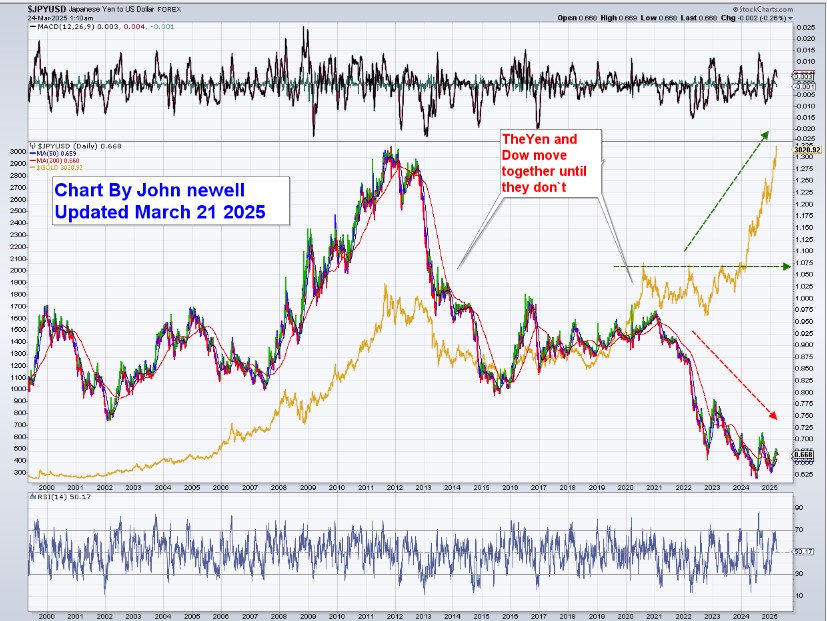
The chart above shows a powerful consolidation pattern, now on the verge of breaking. Just like the Japanese Yen (Chart below) and gold correlation in the 2010s, this will end, with a violent move in one direction.
The only question is: will it be gold or the Dow that wins?
Today it looks like Gold.
GDXJ-to-Gold Ratio: A Once-in-a-Lifetime Opportunity
Adding more evidence to this thesis is the GDXJ-to-Gold ratio, which shows just how badly gold equities have underperformed bullion.
Even as gold surges above $3,000 per ounce, junior mining stocks are priced as if gold were still trading at $1,200. This disconnect is historic. The last time we saw this kind of divergence was in the early 2000s, and what followed was a generational move in the miners.
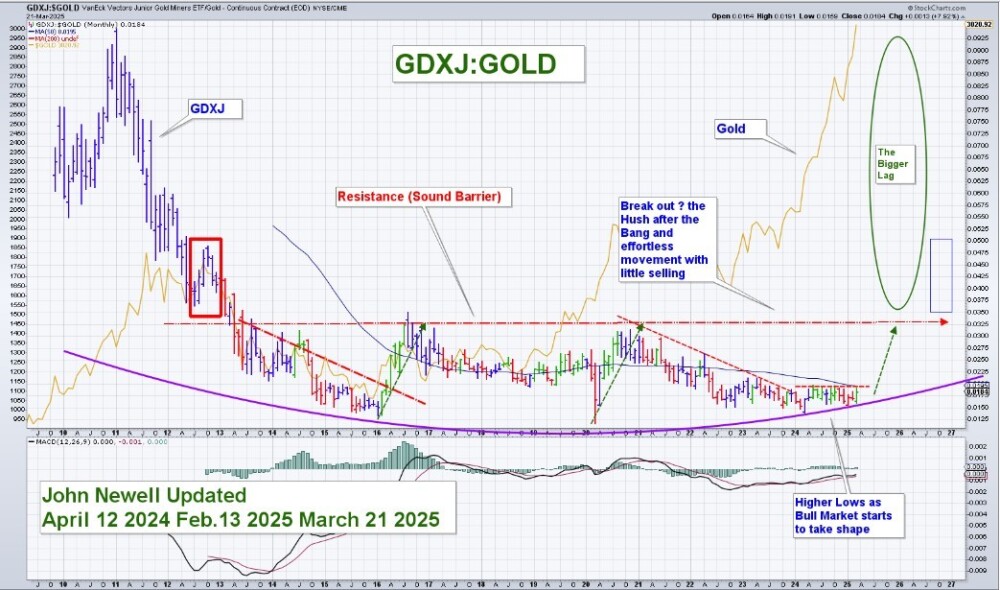
This is not just undervaluation. It’s historic mispricing. While gold has broken into blue-sky territory, gold stocks are still stuck in the basement. The GDXJ / Gold ratio tells the story: shares are lagging so far behind bullion that the reversion trade could be explosive. We’ve seen this before, in 2002, in 2009, and we know how it ends.
When capital rotates, it rotates hard.
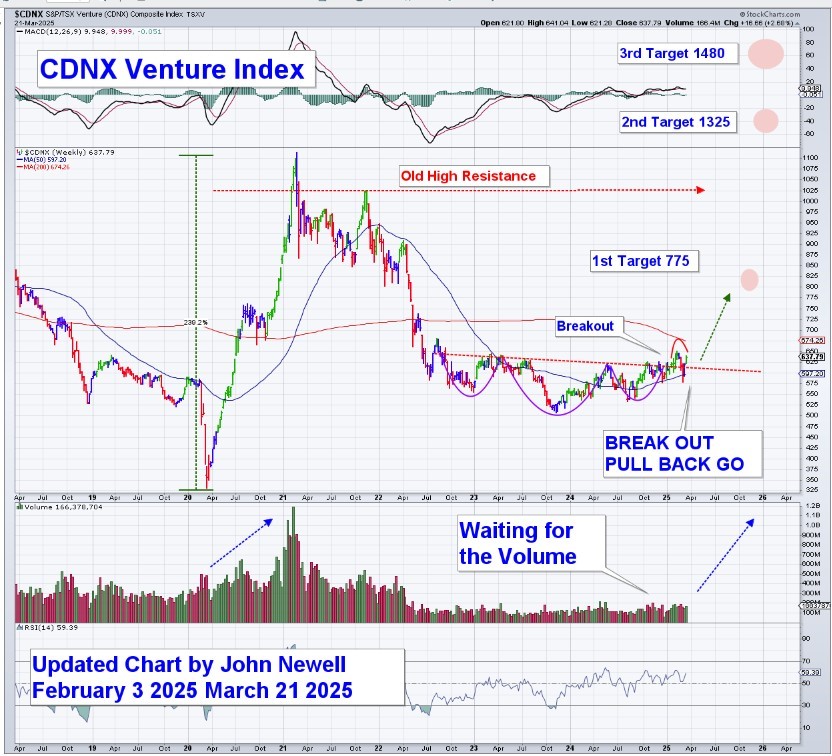
CDNX: The Junior Market Is Stirring
The CDNX Venture Index, a broad measure of Canadian junior mining companies, has just completed a textbook “Breakout, Pullback, Go” formation. After breaking out of a multi-year base, it successfully retested and is now bouncing off support. With upside targets at 775, 1325, and 1480, the technical setup is clear.
Volume is still building, but technically, the juniors are waking up. Smart money is already positioning quietly. If gold continues its upward trajectory, the junior market will not be far behind. When this sector moves, it doesn’t just run; it explodes.
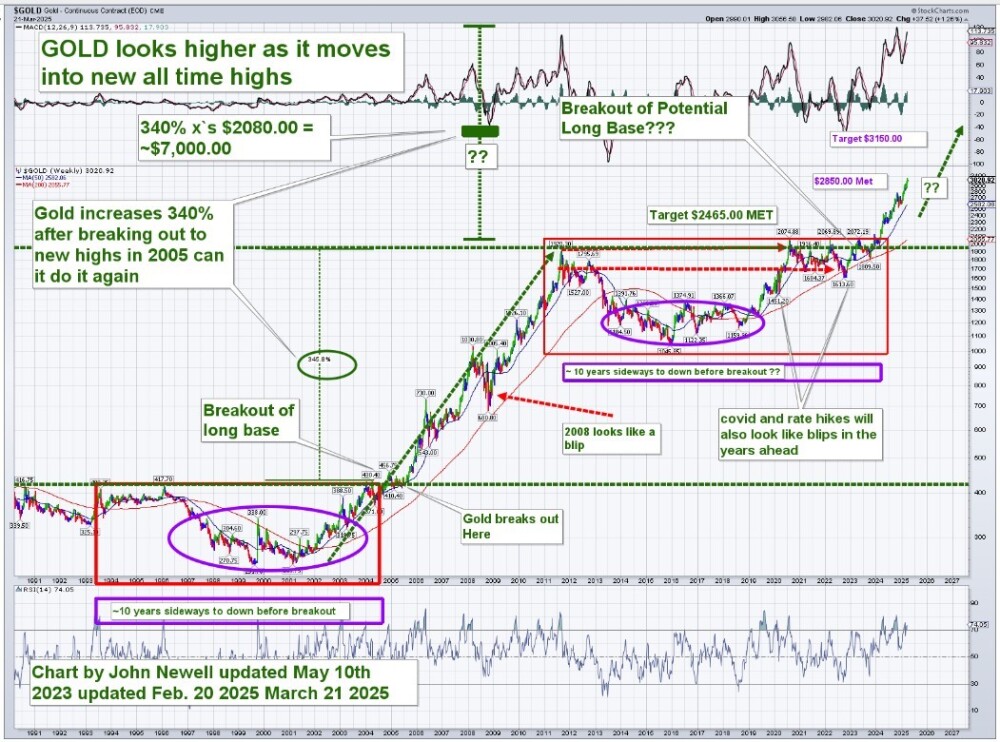
Gold Technical Picture: $7,000–$8,000 in Sight
The gold chart below points to much higher prices ahead.
The 2005 breakout delivered a 340% gain. If we apply that same percentage move from the recent breakout level of $2,080, we land near $7,000.
Another chart shows repeated 8x moves from major base formations.
Gold did this in the 1970s and again in the 2000s. A third 8x move from the 2015–2020 consolidation suggests a target near $8,000.
These aren’t wild guesses. They’re supported by technical patterns, macro pressures, and the same momentum cycles that have defined gold’s behavior for the past century.
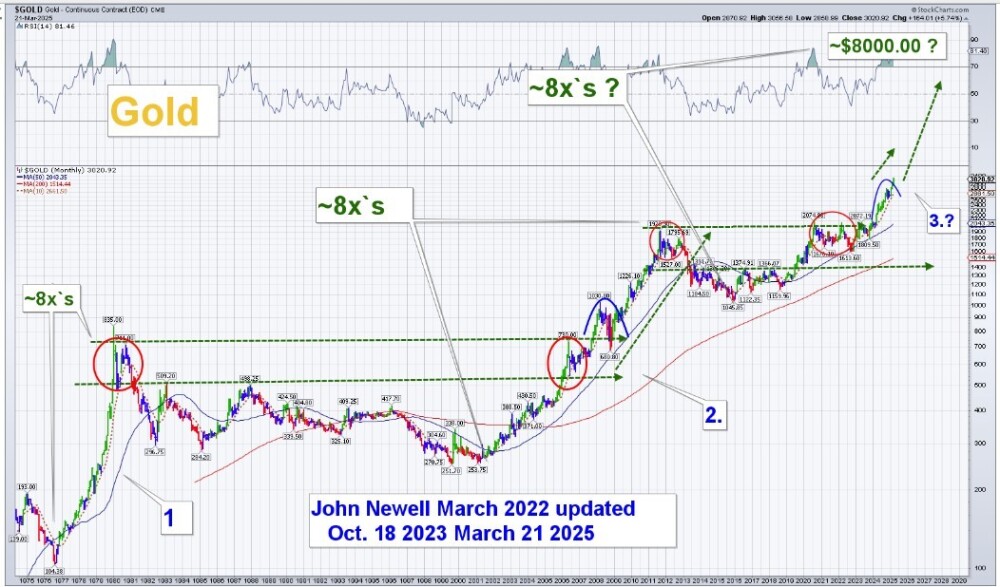
A century of price action is aligning to suggest that the next move in gold will be vertical. The long consolidation is ending. The charts don’t lie.
Macro Fundamentals: Rocket Fuel for Gold
While the technicals provide the roadmap, the fundamentals are supplying the fuel.
First and foremost is the debt. The United States now holds a higher debt-to-GDP ratio than it did at the end of World War II. Unlike then, we haven’t emerged from a global conflict; we’ve simply printed our way into a monetary dead end. Fiat currencies are losing credibility, and gold, true money, is rising to fill the void.
Real interest rates remain deeply negative. Even if inflation cools, rates are still below the cost of living. This is a textbook environment for gold strength. We’re reliving the 1970s in high definition, and gold is the top performer in a stagflation environment.
Meanwhile, central banks around the world are accumulating gold at a record pace. China, Russia, and other sovereign entities are actively de-dollarizing. This is a structural, strategic shift away from U.S. hegemony, and gold is the beneficiary.
Mining supply remains constrained. The discovery rate of large gold deposits has collapsed. Grades are falling. Costs are rising. ESG delays and permitting challenges make new production harder to bring online. That sets the stage for sharply higher prices and surging valuations for exploration and development-stage companies.
USERX: A 50-Year Breakout is Underway
One of the most compelling charts in this setup is USERX, the U.S. Global Investors Gold & Precious Metals Fund.
It serves as a broad proxy for the entire precious metals sector. The fund is now breaking out of a 50-year consolidation pattern. The long-term downtrend line from the 1980s is broken. Price is coiling above rising support.
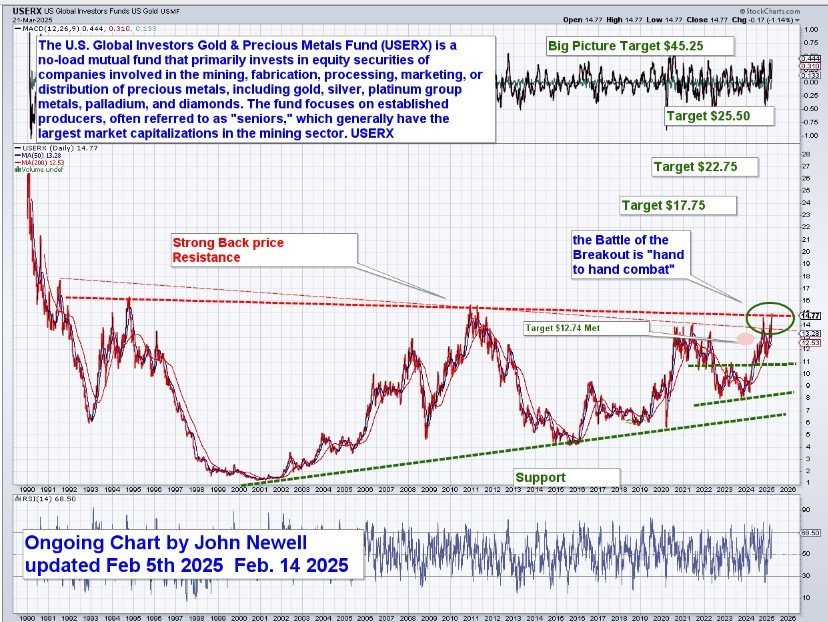
Resistance levels at $17.75, $22.75, and $25.50 are now within reach.
The longer-term target? $45 or more within the next five to seven years. This is not a typical breakout. This is the kind of structural move that redefines capital allocation for an entire generation of investors.
The Rifleman Approach: Targeted, Exponential Investing
USERX is a great proxy, but the real wealth will be made by those who take the Rifleman Approach: precise, selective, and high conviction investing. We’re not talking about shotgun strategies. We’re talking about sniper tactics.
Royalty companies, advanced explorers, and mid-tier producers with strong balance sheets, great assets, and tight share structures will deliver 5x to 10x returns and potentially more.
History proves this. In the 1970s and 2000s bull markets, the biggest winners were the disciplined stock pickers who bet early on the right names. We’re entering a similar phase, one where a handful of great companies will generate generational wealth for those who act now.
HUI: The Third Major Move is Just Beginning (But Brace for Shock & Awe)
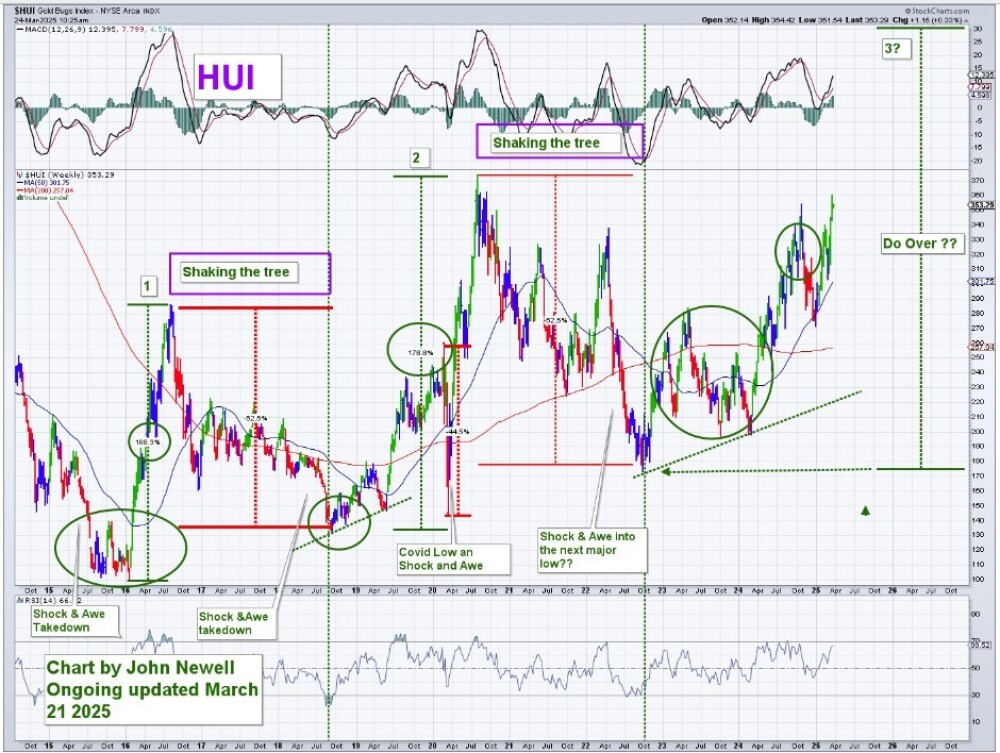
The HUI Gold Bugs Index has historically captured the explosive upside of precious metals equities during gold bull markets. Our updated chart shows two prior rallies, each around 180% in magnitude, that followed prolonged periods of base building and consolidation. Today, we appear to be in the early stages of what could become the third major leg higher in this cycle.
The current setup is strikingly like past moves, both in structure and timing. Rising momentum, a broad base breakout, and increasing relative strength are aligning again. If this pattern holds, and we believe it will, we could be on the verge of another 150–200% rally in precious metals shares over the next several years.
However, even in strong bull markets, corrections can be sharp, fast, and psychologically brutal. We call these “Shock and Awe” corrections sudden drawdowns that seem to come out of nowhere, often at the very moment the market looks its most bullish. They tend to occur around breakouts, new highs, or after extremely strong moves, when sentiment is most confident.
These corrections, often 20% or more, are part of the journey. They shake out the weak hands. But they are not signals to exit. They are signals to prepare, hold your conviction, and stay focused on the long-term trajectory.
This is still early. Gold equities continue to lag bullion by a wide margin. That gap will close, and when it does, it will do so with speed.
B2Gold: A Technical Setup with Compounding Fundamentals
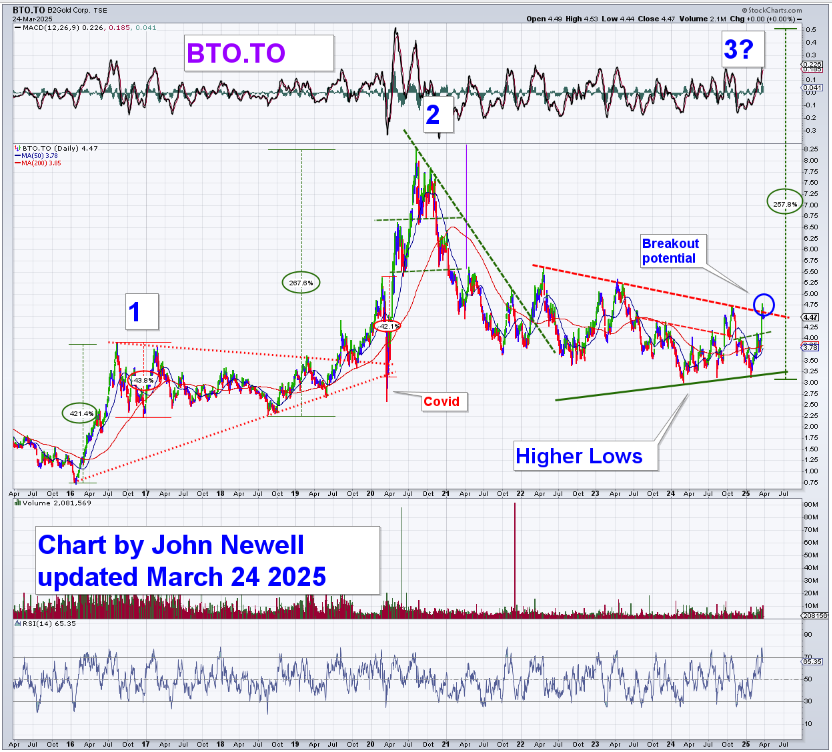
B2Gold Corp. (BTG:NYSE; BTO:TSX; B2G:NSX) is quietly setting up for what could be its third major advance since the gold bull market began in 2016. The chart shows a clear pattern:
- A 421% rally from the 2016 low.
- A second 267% move following the 2019 low.
- Now, in early 2025, B2Gold is forming higher lows and has just tested a breakout zone that could mark the beginning of the third major leg higher.
This setup aligns beautifully with the broader bullish trend in precious metals and the historical tendency for B2Gold to deliver outsized returns once momentum confirms. The technicals are clear: a series of higher lows, converging resistance, and rising RSI and volume suggest that B2Gold may be on the cusp of a powerful upside move.
But this is not just a chart story; it’s a fundamentally driven breakout in the making.
B2Gold presents a unique investment opportunity for investors looking for growth exposure in the gold space, backed by strong leadership and financial discipline. The company has a proven management team, led by Clive Johnson, with a history dating back to Bema Gold, an exploration success story that began in the Yukon and expanded globally. That legacy continues today.
Strategically, B2Gold is making a bold move into Canada by acquiring Sabina Gold and Silver, as well as taking a stake in Snowline Gold, positioning itself in some of the most attractive and stable mining jurisdictions in the world. The Goose Mine in Nunavut is expected to be a transformational asset, potentially increasing overall production and reducing geopolitical risk.
Beyond expansion, B2Gold maintains some of the lowest production costs in the industry. Even after investing heavily in future growth, the company is expected to retain strong margins and robust cash flow generation, especially in a rising gold price environment.
B2Gold’s balance sheet is another standout feature: essentially debt-free, with projected cash reserves exceeding $600 million, and one of the most attractive dividend yields in the gold sector. That combination of growth, financial strength, and shareholder returns is rare.
While exposure to Mali introduces some geopolitical risk, the company’s diversification, with assets in Namibia, the Philippines, Colombia, and now Canada, primarily mitigates that.
In summary, B2Gold offers a compelling combination of technical upside, low-risk balance sheet strength, and smart jurisdictional moves. If the breakout in gold stocks continues to unfold, B2Gold could once again deliver a triple-digit return, just as it has in its past two major bull cycles.
Imperial Metals: Positioned for Copper’s Bull Market
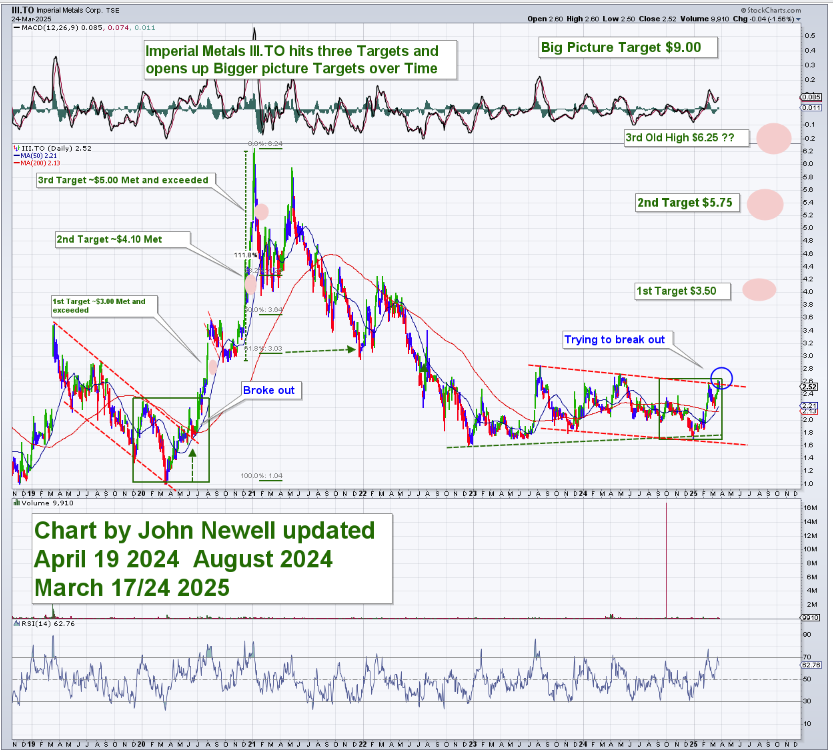
Imperial Metals Corp. (III:TSX; IPMLF:OTCMKTS)is another chart and company that deserves attention in this emerging commodity bull cycle. From a technical perspective, the chart shows a breakout in progress after a long base-building period. Imperial has already met and exceeded its first three technical targets in the past cycle ($3.00, $4.10, and $5.00), and it is now attempting to break out again with potential upside targets of $3.50, $5.75, $6.25, and even $9.00 over time.
This renewed strength aligns with a bullish copper outlook, and Imperial’s positioning makes it one of the more compelling leveraged plays on a copper supply crunch.
Founded in 1959, Imperial Metals has evolved through multiple strategic phases, but its 2007 acquisition of the Red Chris copper-gold project in British Columbia marked a pivotal turning point. The company later sold a 70% stake in Red Chris to Newcrest Mining, retaining 30% and forming a long-term joint venture. With Newmont’s acquisition of Newcrest in 2023, the project now benefits from the financial muscle and operational depth of a major producer, while Imperial retains meaningful upside through its 30% interest.
What makes this even more compelling is the macro backdrop for copper. As the world races toward electrification, through EVs, grid expansion, and renewable energy infrastructure, copper demand is projected to soar. Meanwhile, global supply remains constrained. Imperial controls a measured and indicated copper resource base of approximately 5 billion pounds, offering real leverage to rising copper prices.
Located in British Columbia, Imperial operates in a tier-one jurisdiction with supportive regulatory frameworks and strong relationships with Indigenous communities. This, combined with a tight share structure, offers investors a unique combination of jurisdictional safety, development potential, and high sensitivity to copper prices.
Financially, the company is backed by deep-pocketed shareholders, including N. Murray Edwards (45.02% ownership) and Fairholme Capital (11.86%). With a market cap of ~$410 million and a relatively small tradable float, share price moves can be dramatic when sentiment shifts, making this a high-beta copper play at a time when the market is just starting to re-rate copper equities.
In short, Imperial Metals is a bull market opportunity hiding in plain sight. With strong fundamentals, deep partnerships, and a technically bullish chart, the company stands to benefit significantly as copper becomes one of the most in-demand strategic metals of the next decade.
Conclusion: All Pedal, No Brake
This is not a moment of fear. It’s a moment of opportunity. The breakout is real. The momentum is building. Capital is already rotating. And the precious metals sector is preparing to lead.
This is it. The charts are telling us. The fundamentals are aligning. The breakout is underway. All pedal. No brake.
But a word of caution is also in order. The very act of writing a bullish article like this one reflects a moment where prices have already begun to move, where confirmation is visible on the charts, and where optimism is increasingly justified. Ironically, these are often the moments when markets deliver their sharpest corrections. It’s not a reason to doubt the long-term trend, but a reminder of how markets behave in real time.
Corrections, sometimes fast and unforgiving, are a natural part of the journey, especially in sectors like precious metals that are prone to emotional extremes. So be bold, but not reckless. Be aggressive, but precise. This is a moment for focused conviction, not blind enthusiasm.
This is the wealth cycle of our generation. Let’s ride with eyes open and strategy in hand.
Sign up for our FREE newsletter at: www.streetwisereports.com/get-news
Important Disclosures:
- John Newell: I determined which companies would be included in this article based on my research and understanding of the sector.
- Statements and opinions expressed are the opinions of the author and not of Streetwise Reports, Street Smart, or their officers. The author is wholly responsible for the accuracy of the statements. Streetwise Reports was not paid by the author to publish or syndicate this article. Streetwise Reports requires contributing authors to disclose any shareholdings in, or economic relationships with, companies that they write about. Any disclosures from the author can be found below. Streetwise Reports relies upon the authors to accurately provide this information and Streetwise Reports has no means of verifying its accuracy.
- This article does not constitute investment advice and is not a solicitation for any investment. Streetwise Reports does not render general or specific investment advice and the information on Streetwise Reports should not be considered a recommendation to buy or sell any security. Each reader is encouraged to consult with his or her personal financial adviser and perform their own comprehensive investment research. By opening this page, each reader accepts and agrees to Streetwise Reports’ terms of use and full legal disclaimer. Streetwise Reports does not endorse or recommend the business, products, services or securities of any company.
For additional disclosures, please click here.
John Newell Disclaimer
As always it is important to note that investing in precious metals like silver carries risks, and market conditions can change violently with shock and awe tactics, that we have seen over the past 20 years. Before making any investment decisions, it’s advisable consult with a financial advisor if needed. Also the practice of conducting thorough research and to consider your investment goals and risk tolerance.

( Companies Mentioned: BTG:NYSE; BTO:TSX; B2G:NSX,
III:TSX;IPMLF:OTCMKTS,
)
Categories
Copper Is Threatening New All Time Highs!

Source: Michael Ballanger 03/25/2025
Michael Ballanger of GGM Advisory Inc. shares his thoughts on the current state of the market.
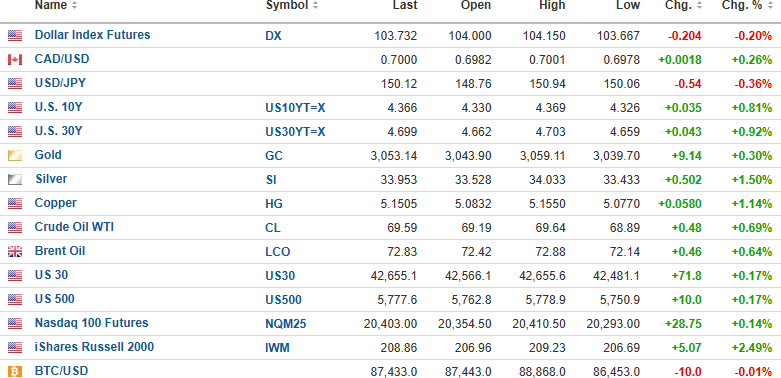
U.S. Dollar Index futures are down 0.20% to 103.732, while the 10-year bond yield is up 0.81% to 4.366%, and the 30-year bond yield is up 0.92% to 4.699%.
Gold (+0.30%), silver (+1.50%), copper (+1.44%), and oil (+0.69%) are all higher. The DJIA futures (+0.17%) are higher by 71.8 points, while the S&P 500 futures (+0.17%) are up 10 points and the NASDAQ 100 futures (+0.14%) are up 28.75 points.
Risk barometer Bitcoin is down 0.01% to $87,433 and barely in bear market territory, down an even 20.09% from the top.
Stocks
The Trump “tariffs on, tariffs off” fiasco sent stocks sharply higher yesterday, taking Freeport-McMoRan Inc. (FCX:NYSE) up 3.38% to $41.61, and it is $42.25 bid in the pre-opening market. All the copper producers caught a big bid since last week, so while it came a little too late for the March $40 calls, the additional stock and the June $40 calls are making up for it in spades. I see $45-47 by Friday, and it would be a lot higher if copper could break out to record highs.
The SPY:US was a tempting trade for me last week after I called the lows around March 7. I covered all puts and sold the big volatility trade (UVIX:US) at $40.50 (now $29.20) a few premature days before it hit $52.99 on March 10. Catching the lows of that correction was not that difficult as every time the CNBC Fear-Greed index gets into the <EXTREME FEAR> quadrant, the market is usually ripe for a rally.
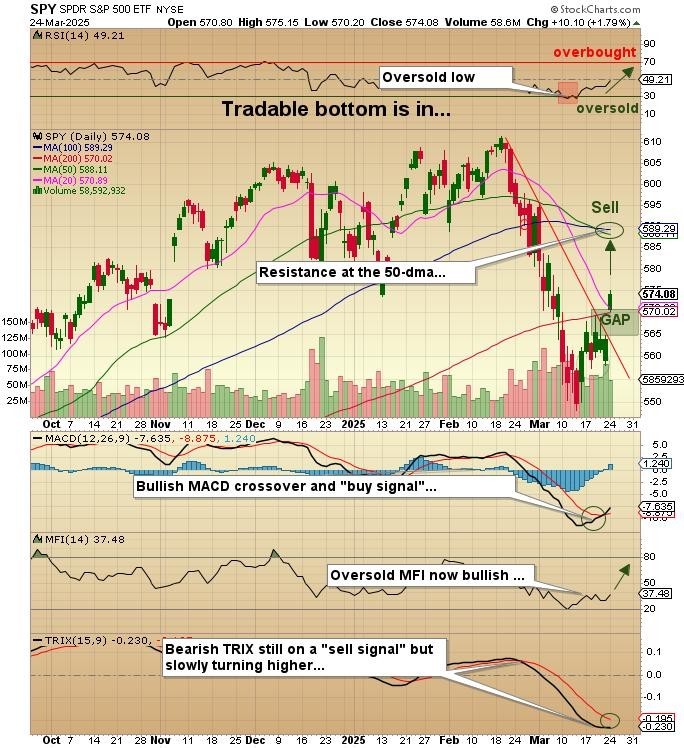
The SPY:US is now rallying on a MACD “buy signal” and a bullish reversal in the Money Flow Indicator. TRIX is lagging, being it is a longer-term indicator, but it is starting to turn up, which is encouraging. RSI at 49.21 gives this trade a great deal of runway and a legitimate shot at the 50-dma at $588.11, which is $14 higher from yesterday’s close. I will not be putting on any new positions as I am traveling until April 11, but for those subscribers looking for a trade, I think it is safe to take a position with a stop at $550. However, follow it up with trailing stops because the first rally off a correction low rarely lasts and is often followed by a retest.
If that retest fails and markets move to new lows, then the $613.23 top reached on Feb. 19 will be the bull market top and the start of a new bear market. So, be very nimble if you take the trade.
No recommended action on FCX or the FCX June $40 calls as I think the copper producers are ridiculously cheap relative to spot copper at $5.15/lb.
Metals
Copper remains the rock star in the metals arena this morning as it has new highs written all over it.
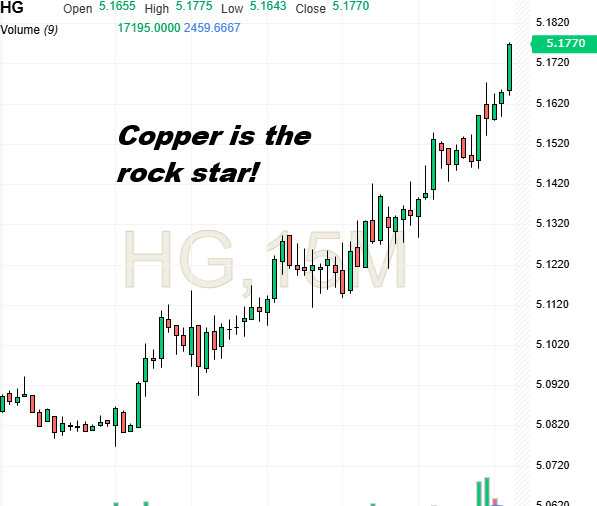
If we get a breakout through the old high at $5.199, I am forced to look back at the correction in 2024 from the May top to the low in August of 25% and then the correction from September until the last day of 2024, which was 16%.
Using those two percentage numbers as benchmarks, if $5.199 is overtaken, then the target range for Cu is $6.03-6.51 per pound. In the copper world, that is insanely profitable for companies like FCX, but that kind of pricing places incredible upside pressure on new copper discoveries in the mode of what we may hear from FTZ/FTZFF from Caballos.
You all now know my strategy for this exciting little junior. I will not even think of selling until they drop a few deep holes beneath that oxide cap at Buen Retiro and if it turns out to be massive sulphides as in IOCG mineralization, then the only action will be a tendering of my shares to an offer.
More later in the day if I have time.
Sign up for our FREE newsletter at: www.streetwisereports.com/get-news
Important Disclosures:
- Michael Ballanger: I, or members of my immediate household or family, own securities of: All. My company has a financial relationship with: All. I determined which companies would be included in this article based on my research and understanding of the sector.
- Statements and opinions expressed are the opinions of the author and not of Streetwise Reports, Street Smart, or their officers. The author is wholly responsible for the accuracy of the statements. Streetwise Reports was not paid by the author to publish or syndicate this article. Streetwise Reports requires contributing authors to disclose any shareholdings in, or economic relationships with, companies that they write about. Any disclosures from the author can be found below. Streetwise Reports relies upon the authors to accurately provide this information and Streetwise Reports has no means of verifying its accuracy.
- This article does not constitute investment advice and is not a solicitation for any investment. Streetwise Reports does not render general or specific investment advice and the information on Streetwise Reports should not be considered a recommendation to buy or sell any security. Each reader is encouraged to consult with his or her personal financial adviser and perform their own comprehensive investment research. By opening this page, each reader accepts and agrees to Streetwise Reports’ terms of use and full legal disclaimer. Streetwise Reports does not endorse or recommend the business, products, services or securities of any company.
For additional disclosures, please click here.
Michael Ballanger Disclosures
This letter makes no guarantee or warranty on the accuracy or completeness of the data provided. Nothing contained herein is intended or shall be deemed to be investment advice, implied or otherwise. This letter represents my views and replicates trades that I am making but nothing more than that. Always consult your registered advisor to assist you with your investments. I accept no liability for any loss arising from the use of the data contained on this letter. Options and junior mining stocks contain a high level of risk that may result in the loss of part or all invested capital and therefore are suitable for experienced and professional investors and traders only. One should be familiar with the risks involved in junior mining and options trading and we recommend consulting a financial adviser if you feel you do not understand the risks involved.

Categories
A New Global Financial Order Lies Ahead

Source: Adrian Day 03/25/2025
Global Analyst Adrian Day examines something fundamental, with long-term ramifications for markets and much more. As readers know, Day does not often discuss such broad topics, but he believes this is so important that it needs consideration and thought.
When I first discussed the Mar-A-Lago Accord back in January, no one in the audience had heard of it. Certainly, more have today. In fact, recent headlines have proclaimed that “Wall Street Can’t Stop Talking About It.” But you will soon be hearing a lot more about it, something that promises (or threatens) to be one of the most important financial developments of the post-war world.
The “Mar-A-Lago Accord” refers to a set of economic and monetary policies espoused by President Trump and various people around him in and out of the administration (such as Steve Bannon and Oren Cass) to reset the global financial system. The name is a riff on the “Plaza Accord” in 1985 that aimed to drive down the value of the dollar. It is not (yet) a specific clear plan. Rather, it is a collection of ideas, some well-formulated, some aspirational, and some conflicting. As respected advisor Jim Bianco put it, “It’s not a thing. It’s a concept.”
What Is It Trying To Achieve and Why?
The aims behind the so-called Accord are to lower debt and interest payments; get foreign countries to pay more and end what is viewed as foreign countries living off the U.S; end what Stephen Miran, nominee to head the White House Council of Economic Advisors in a paper last November called “persistent dollar overvaluation;” and bring manufacturing back to the U.S.
Some of the thinking behind these moves — and here I summarize the research of Julien Garren and Andy Lees at the British research firm MicroStrategy, as outlined in this video — is that the policies of the liberal world order of the past 50 years have combined to undermine the welfare of blue-collar workers and increasingly the middle classes; that globalism led to one-sided free trade with governments that used slave labor against which the West could not compete; used tariffs and other barriers to limit U.S. exports; and manipulated their currencies to keep the dollar strong.
This led to policies in the West and the U.S. that included increased welfare, higher taxes, more bureaucracy, and mass immigration, in turn inducing a wave of populism in Europe and then the U.S.
One can readily see that the issues leading to the Mar-A-Lago Accord are wide-ranching and deep-seated, and so too are the proposals: they seek nothing less than to overturn the global financial order of the past 50 years.
The ideas behind some of these thoughts are real, if one-sided and exaggerated. It is true that the U.S. is paying an inordinate amount towards the defense of foreign countries (as did Britain when it was the world’s leading power, and indeed, as did other Empires back to Rome). It is true that many foreign countries tax imports from the U.S. more than the U.S. taxes foreign imports. Some proposals are misguided: the idea of a debtor nation launching a sovereign wealth fund is flawed. And some are contradictory. A paper by Zoltan Pozsar (formerly a director at Credit Suisse) calls for the dollar to play a less dominant role in global finance, a goal echoed throughout the Mar-A-Lago Accord proposals. However, President Trump has said that the BRICS countries face 100% tariffs if they turn away from the dollar. Similarly, encouraging investment into the U.S. manufacturing sector works against a lower dollar.
Being the Reserve Currency Brings Benefits as Well as Duties
And some are wrong or, at minimum, incomplete: having the world’s reserve currency is called “the exorbitant privilege.” It enables the country to print more money than it otherwise could, knowing that other countries will buy into its debt. Thus, it increases the country’s standard of living and exports inflation but also increases the value of the currency.
Admittedly, this is not so much fun when the reserve baton is passed on. Just look at Britain. By attempting to diminish the U.S. dollar’s role, they will soon learn that this leads to a lower currency, yes (and more expensive imports), but also to higher inflation, higher interest rates, and a lower standard of living. Be careful what you wish for! No country in the history of the world (of which I am aware) has ever become and remained wealthy through a cheap currency.
There are several specific policies floated as part of this Accord to achieve the aims above. This includes, most notably, tariffs and the notion of an “External Revenue Service.” There is the idea from Treasury Secretary Scott Bessent to monetize the U.S.’s assets. The focus in discussions following those comments has been on revaluing the U.S. gold stockpile, currently valued at $42.22. Revaluing at the market would increase the valuation by almost $800 billion. It is difficult to see what practical effect revaluing an asset would have, other than improving the look of the government’s balance sheet, unless the gold were sold or leased.
The idea has been floated of using government assets as collateral for loans, thus — theoretically, at least — reducing the interest rate required to be paid on these loans. There are other assets, of course, including National Parks and enterprises owned by the government (the Post Office, Amtrack) that could be privatized.
It Worked In 1985, but Would It Work Today?
One proposal would require foreign governments to exchange Treasuries that they hold for 100-year, non-tradeable zero coupon bonds. Clearly, no holder would willingly do that unless the U.S. stopped paying interest and defaulted. But there will be a carrot-and-stick approach.
In essence, the U.S. would link the bond exchange with both security and access to U.S. markets. “Swap your bonds, and the U.S. military will defend you, and your goods will have preferential access to our market. Do not, and you are on your own militarily and without ready access to our markets.”
In 1985, at the time of the Plaza Accord, allies Japan, Taiwan, Canada, and Germany had the largest trade surpluses with the U.S. Today. China has the largest trade surplus with the U.S., while Vietnam has the third largest (Mexico has the second), and they will not so readily succumb to U.S. carrots or sticks.
Certainly, the leading trade surplus countries in 1985 relied on U.S. security, but that is not the case with many of today’s leading surplus countries. Similarly, the countries with the largest holdings of long-term Treasuries are not likely to take kindly to these threats.
Under the proposal, if a country that had swapped its bonds needed cash urgently in a crisis, the Federal Reserve would make funds available as a loan. Essentially, the country would go from receiving interest on Treasuries to paying the U.S. on a loan. Of course, this position, like most others, can be seen as an initial negotiating stance.
Governments might be punished for selling their treasuries before this proposal becomes a reality, but the mere idea of such a proposal is hardly an incentive for governments to buy more U.S. bonds. This will only speed up the move away from the dollar in foreign central bank reserves. In the short term, this may well help depress the value of the dollar (over what it otherwise would be), but would also make it more difficult for the U.S. to sell long-term bonds, thus driving up yields at the long end.
A US Debt Crisis Is Ahead
There are many other such proposals, but they all tie together with the aim of getting foreign countries to pay more and for it to be easier for the U.S. to finance its debt.
Bianco hit the nail on the head when he advised, “Don’t take this literally but do take it seriously.” He adds that it is important to emphasize the magnitude of the potential changes in store.
Famed hedge fund manager Ray Dalio commented that the size of the U.S. debt problem could lead to what he calls “shocking developments.” He continues: “Just as we are seeing political and geopolitical shifts that seem unimaginable to most people if you just look at history, you will see these things repeating over and over again.”
Many of the issues these policies aim to solve Vietnam such as the U.S. paying too much for the defense of other countries, or the decline of manufacturing in the U.S. Vietnam have been long standing. The move toward a U.S. debt crisis similarly did not just start overnight. It was, in my mind, criminal negligence for the Treasury under President Obama not to issue ultra-long-term bonds when the Fed Funds rate was at zero.
If Austria and even Argentina could issue 100-year bonds (with yields in the 7s for the former and less than 1% for the latter) could not the U.S. also have done so.
But that opportunity has passed. The debt crisis is moving rapidly to its Götterdämmerung, accelerated by the reckless spending on the last administration in the two months after the election. On Friday, January 14, then-Treasury Secretary Janet Yellen bequeathed her parting gift to the incoming administration when she said that the U.S. government would hit its debt ceiling on the 18, President Trump’s first full day in office.
The Likely Implications for Markets and for Gold
These proposals, depending on whether they are implemented successfully, could help or hurt the dollar, global stock markets, and U.S. bonds over varying time frames, but every single one is gold-positive.
I suspect that in the near term, we will see stock market weakness (after a contrarian rally), bond market weakness, and some dollar weakness.
But gold will likely move higher over the near term as well as the longer term. Gold reacts positive to chaos and uncertainty, to disruption and volatility.
Further, as Goehring & Rozencwajg have noted, every past commodity bull market has been set in motion by a change in the global monetary system. “A major shift in the global monetary system may be imminent” and commodities are, and will, respond to this.
Sign up for our FREE newsletter at: www.streetwisereports.com/get-news
Important Disclosures:
-
Statements and opinions expressed are the opinions of the author and not of Streetwise Reports, Street Smart, or their officers. The author is wholly responsible for the accuracy of the statements. Streetwise Reports was not paid by the author to publish or syndicate this article. Streetwise Reports requires contributing authors to disclose any shareholdings in, or economic relationships with, companies that they write about. Any disclosures from the author can be found below. Streetwise Reports relies upon the authors to accurately provide this information and Streetwise Reports has no means of verifying its accuracy.
- This article does not constitute investment advice and is not a solicitation for any investment. Streetwise Reports does not render general or specific investment advice and the information on Streetwise Reports should not be considered a recommendation to buy or sell any security. Each reader is encouraged to consult with his or her personal financial adviser and perform their own comprehensive investment research. By opening this page, each reader accepts and agrees to Streetwise Reports’ terms of use and full legal disclaimer. Streetwise Reports does not endorse or recommend the business, products, services or securities of any company.
For additional disclosures, please click here.
Adrian Day Disclosures
Adrian Day’s Global Analyst is distributed for $990 per year by Investment Consultants International, Ltd., P.O. Box 6644, Annapolis, MD 21401. (410) 224-8885. www.AdrianDayGlobalAnalyst.com. Publisher: Adrian Day. Owner: Investment Consultants International, Ltd. Staff may have positions in securities discussed herein. Adrian Day is also President of Global Strategic Management (GSM), a registered investment advisor, and a separate company from this service. In his capacity as GSM president, Adrian Day may be buying or selling for clients securities recommended herein concurrently, before or after recommendations herein, and may be acting for clients in a manner contrary to recommendations herein. This is not a solicitation for GSM. Views herein are the editor’s opinion and not fact. All information is believed to be correct, but its accuracy cannot be guaranteed. The owner and editor are not responsible for errors and omissions. © 2023. Adrian Day’s Global Analyst. Information and advice herein are intended purely for the subscriber’s own account. Under no circumstances may any part of a Global Analyst e-mail be copied or distributed without prior written permission of the editor. Given the nature of this service, we will pursue any violations aggressively.

Source: Streetwise Reports 03/25/2025
Top-tier silver producer MAG Silver Corp. (MAG:TSX; MAG:NYSE American) has reported its financial results for 2024 and declared an inaugural dividend for stockholders. See why analysts like this company with a major mine in Mexico.
Top-tier silver producer MAG Silver Corp. (MAG:TSX; MAG:NYSE American) has reported its financial results for 2024 and declared an inaugural dividend of a total of US$0.18 per share.
The payment is a fixed dividend of US$0.02 per share and an additional cash flow-linked dividend of US$0.16 per share, or about 30% of the cash the company received from its 44% Juanicipio joint venture (JV) with Fresnillo Plc.
“We expect a positive reaction from MAG shares following Q4 financial results, which were ahead of consensus,” a Flash Note from research firm TD Cowen noted on March 24. “More importantly, lower operating costs continued to showcase impressive margins at Juanicipio, and the company declared its widely-anticipated inaugural dividend of US$0.18/share. The implied annualized dividend yield of 4.6% is the highest in our precious metals universe.”
The firm held a Buy rating on the stock with a price target of US$27.
“The announcement of our dividend policy and inaugural dividend is a major milestone for MAG and validates our confidence in the overall strength and sustainability of our business,” President and Chief Executive Officer George Paspalas said. “This inaugural dividend, with both fixed and cash flow linked components, demonstrates our dedication to delivering consistent value while sharing Juanicipio’s operational and financial success with our shareholders.”
MAG said the declaration, timing, amount, and payment of future dividends will be subject to the discretion and approval of the Board of Directors and it will review the dividend program “on an ongoing basis and may amend it at any time.”
Juancipio Continues to Improve
For the year 2024, the company reported a net income of US$77.78 million, or US$0.75 per share, driven by income from Juanicipio of US$92.88 million and adjusted EBITDA of US$186.73 million.
“We expect a positive reaction from MAG shares following Q4 financial results, which were ahead of consensus,” a Flash Note from research firm TD Cowen noted on March 24.
In addition to paying an inaugural dividend of US$26.4 million to MAG, Juanicipio returned a total of US$97.38 million in interest and loan principal repayments to MAG for a total capital return in 2024 of US$123.78 million, further augmenting MAG’s cash position to US$162.35 million at the end of the year, the company said.
A total of 1,328,178 tonnes of ore at a silver head grade of 468 grams per tonne (g/t) (equivalent silver head grade of 712 g/t) was processed at Juanicipio, which achieved silver production and equivalent silver production of 18.6 and 26.8 million ounces (Moz), respectively.
Silver recovery at Juanicipio improved to 93% from 87% in 2023, reflecting the commencement of commercial pyrite and gravimetric concentrate production during the second quarter of 2024, delivering incremental silver and gold recovery, paired with ongoing optimizations in the processing plant, MAG noted.
Forecast for 2025
For 2025, Fresnillo reports silver production at Juanicipio is forecasted to range between 14.7 Moz 16.7 Moz, yielding between 13.1 million and 14.9 million payable ounces. This guidance is based on a throughput rate of 4,000 tonnes per operating day at a head grade range of 380 g/t to 430 g/t silver (Ag). The gold head grade is expected to range between 1.2 g/t to 1.4 g/t.
In an updated research note reacting to the financial results and dividend on March 24, National Bank of Canada Analyst Don DeMarco maintained his Outperform rating on the stock with a CA$30.50 price target.
“Our thesis considers production growth at Juanicipio (44%), diversified metal production, a re-rate to producer multiples, exploration upside and M&A appeal tempered by Juanicipio JV terms, which limit profit sharing to once per year,” DeMarco wrote.
Paspalas said he expects performance at the project to continue to improve in 2025.
The Catalyst: Precious Metal Has Big Industrial Uses
The silver market rallied Monday but showed signs of hesitation near the crucial US$33.33 level, Christopher Lewis reported for FX Empire.
“All things being equal, the markets do look as if they are trying to break higher, but there is quite a bit of resistance at that US$33.33 level as well,” he wrote. “So, I think what we need to do is practice a little bit of patience and certainly a lot of position sizing and money management at this point.”
Lewis continued, “Silver does tend to be very noisy under the best conditions and these aren’t the best of conditions, so it’s going to be even more noisy than usual.”
Lewis did note that it was “only a matter of time before we break higher.”
Silver’s industrial utility comes in clearer when contrasting it to the current gold market, which is setting multiple record highs as a safe haven in times of financial and geopolitical uncertainty.
According to James Hyerczyk of FX Empire on February 23, silver has gained at least 14% so far this year, following a robust 21% rise in 2024, reflecting strong demand across both precious and industrial markets.
“Silver’s outlook remains positive, driven by both monetary and industrial demand,” Hyerczyk wrote. “As inflation fears persist and geopolitical risks grow, silver’s dual role as a precious metal and an industrial commodity provides a robust foundation for further gains. While the potential for new tariffs adds uncertainty to industrial demand, silver’s safe-haven appeal should continue to attract investors looking for stability.”
It’s the industrial role that comes into play to help create the deficit for silver, which is the best conductor of electricity among the metals.[OWNERSHIP_CHART-536]
“Underpinning silver’s fundamentals is robust demand from industrial applications,” The Silver Institute said in its World Silver Survey 2024 report. “These continued to push higher last year, reaching a new all-time record, fueled by the remarkable rise in solar demand and in spite of stagnation in some other sectors. Sluggish silver supply, owing to the slight decline in global mine production, was another factor contributing to silver’s deficit conditions last year.”
Mordor Intelligence noted that silver is expected to register a compound annual growth rate (CAGR) of more than 5% between 2024 and 2029.
Ownership and Share Structure
Institutions own 70% of MAG, and 30% is retail, according to the company.
Top institutional shareholders include Juanicipio operator Fresnillo Plc. with 9%, BlackRock Investment Management (UK) Ltd. with 10.8%, Van Eck Associates Corp. with 9%, First Eagle Investment Management LLC with 6.2%, and Sprott Asset Management LP with 3%, the company said.
MAG Silver has a market cap of US$2.35 billion. It has 103.36 million shares outstanding, according to Reuters. It trades in a 52-week range of CA$12.24 and CA$18.27.
Sign up for our FREE newsletter at: www.streetwisereports.com/get-news
Important Disclosures:
- MAG Silver Corp. is a billboard sponsor of Streetwise Reports and pays SWR a monthly sponsorship fee between US$4,000 and US$5,000.
- Steve Sobek wrote this article for Streetwise Reports LLC and provides services to Streetwise Reports as an employee.
- This article does not constitute investment advice and is not a solicitation for any investment. Streetwise Reports does not render general or specific investment advice and the information on Streetwise Reports should not be considered a recommendation to buy or sell any security. Each reader is encouraged to consult with his or her personal financial adviser and perform their own comprehensive investment research. By opening this page, each reader accepts and agrees to Streetwise Reports’ terms of use and full legal disclaimer. Streetwise Reports does not endorse or recommend the business, products, services or securities of any company.
For additional disclosures, please click here.

( Companies Mentioned: MAG:TSX; MAG:NYSE American,
)
U.S. Critical Mineral Imports: Risks, Trade Wars, and How to Protect Your Wealth with Gold The United States heavily relies on foreign critical mineral imports, particularly from Canada and China. Trade wars and geopolitical tensions have put these imports at risk, impacting industries like defense, energy, and manufacturing. The U.S. government is taking steps to […]

Gold just smashed through the $3,000 barrier for the first time in history. On March 14, 2025, gold touched $3,004.86 before settling back slightly — an achievement that’s got investors worldwide buzzing.

While many headlines celebrate this milestone, investors are asking a burning question: “Is it too late to jump on the gold train?”
With gold prices shattering records, it’s easy to understand the hesitation. Nobody wants to be the last one buying at the peak.
But the past and current market signals suggest this might not be the ceiling but another stepping stone in gold’s upward climb.
What Pushed Gold Beyond $3,000
Gold’s path to $3,000 happened remarkably fast. According to the World Gold Council, gold took just 210 days to jump from $2,500 to $3,000 — a surge that defied historical trends. For context, previous $500 price jumps took an average of 1,708 days (nearly five years). Clearly, unusual forces are driving the gold market right now.
“Traditional gold buyers returned to the market when equities faltered,” noted Tai Wong, an independent metals trader quoted by Reuters. Wong described the surge as driven by “beleaguered investors seeking the ultimate safe-haven asset given Trump’s tumult on stock markets.”
This stunning rally has caught the eye of major banks. Goldman Sachs recently raised its year-end gold forecast to $3,100 (up from $2,890), citing “structurally higher central bank demand” alongside growing investor appetite for safe-haven assets. Meanwhile, ING analysts projected gold could reach this milestone in Q1 2025 — a prediction that proved spot-on.
Why Gold May Continue To Soar
While $3,000 an ounce sounds like a lofty price, several powerful forces suggest gold hasn’t reached its ceiling yet:
Central Bank Purchases
Central banks across the globe have been loading up on gold like never before. China leads the pack, adding to its reserves for sixteen consecutive months through February 2025. As the World Gold Council reports, China added nearly 225 metric tons to its stockpile last year, followed by Poland (130 tons) and Singapore (76 tons).
Why are nations buying so much gold?
They’re moving away from the U.S. dollar, which still dominates global reserves but faces growing problems. Asian central banks, in particular, are buying gold for a number of reasons:
Security against potential sanctions (as demonstrated by the freezing of Russian assets in 2022)
Hedging against dollar devaluation
Building buffers against geopolitical volatility
Reducing exposure to other countries’ monetary policies
“We believe that central bank gold buying will remain structurally higher than before the freezing of Russian central bank reserves in 2022. We think this is the case even after a potential Russia-Ukraine ceasefire,” noted Goldman Sachs analysts.
Unpredictable Tariffs
President Trump’s aggressive tariff policies have rattled global markets and fueled gold’s climb. Recent threats of 200% tariffs on European wines, champagnes, and other alcoholic beverages — in response to EU tariffs on American whiskey — exemplify the escalating trade tensions.
U.S. Commerce Secretary Howard Lutnick’s comment that a recession would be “worth it” to implement Trump’s economic policies has further spooked investors. As ING analysts observed, “With Trump back in the White House, uncertainty and unpredictability are running high. Gold will continue to benefit from this environment.”
These tariff disputes aren’t just political theater — they trigger real economic consequences that typically boost gold:
Market volatility spikes, sending investors to safe havens
Inflation fears grow as import prices rise
Currencies bounce around unpredictably
Global growth forecasts get revised downward
The impact of these tariffs shows up clearly in recent reports. JP Morgan’s market review reported that in February, “Services activity and small business investment intentions both fell, while consumer confidence registered its largest decline since August 2021.” When economic confidence drops, gold usually rises.
Why Some Are Selling Gold Now
Not everyone’s buying gold at current prices. Some investors are cashing in profits after gold’s spectacular run, which has delivered stronger returns than most major asset classes over the past year.
Technical signs suggest gold might be overheated. The World Gold Council points out that gold is currently trading three standard deviations above its 200-day moving average — an extreme reading that often leads to cooling-off periods.
Some market watchers also warn that certain drivers could reverse:
A Russia-Ukraine ceasefire could reduce safe-haven demand
Federal Reserve policy shifts could strengthen the dollar
Profit-taking could trigger short-term corrections
For folks who need cash for personal reasons, selling some gold at these record prices makes good sense. But for most long-term investors, these short-term ups and downs shouldn’t change their overall strategy.
Is It Too Late To Buy Now? Not at All
The past teaches us something important: at every major gold price milestone — $400, $800, $1,000, $1,800 — many people held back, thinking gold was “too expensive” and had “peaked.”
Those price points look like bargains today.
When gold first crossed $1,000 in March 2008, many investors thought they’d missed the boat. Those who bought anyway saw their money triple over the next 17 years. Similarly, buyers at $2,000 in 2020 have seen 50% gains in just five years.
Future investors will probably look back at $3,000 gold wishing they’d bought more: “If only I’d bought back then…”
The World Gold Council notes that beyond short-term swings, gold remains strong thanks to “a mix of geopolitical and economic uncertainty, rising inflation, lower rates, and a weaker US dollar.”
For those still unsure, here are some buying strategies to think about for buying gold:
Buy in batches: Instead of one big purchase, spread your buys over time to ride out price swings.
Set a fixed amount: Put a certain portion of your savings into gold rather than trying to guess the “perfect” time.
Physical gold: Gold bullion coins give you both investment value and easy selling options.
Mix your metals: Balance gold with silver and platinum to spread risk within precious metals.
The current gold spot price shows today’s value, but the long-term picture points to continued strength. Gold has proven its worth through countless economic storms. While paper assets can drop to zero, gold has kept its value for thousands of years through countless economic cycles and currency failures.
What makes today special is how many positive factors are hitting at once: central bank buying, trade tensions, inflation worries, and growing distrust in banking systems. These forces have created not just a temporary price jump but possibly a fundamental shift in how markets view gold.
Conclusion
Gold breaking through $3,000 isn’t just a headline — it reflects deep economic changes and ongoing global uncertainties. Nobody can predict day-to-day price moves, but the trends that pushed gold to this level don’t look ready to reverse anytime soon.
When’s the best time to buy gold? The old answer still applies: the best time was yesterday, and the next best time is today. Even at $3,000, gold keeps doing what it’s always done — protecting wealth when everything else looks shaky.
Call us today to learn more about adding precious metals to your investment portfolio, or sign up for our daily spot price emails to stay informed of market movements.
The post Gold Hit $3,000 an Ounce: Is It Too Late to Buy In? first appeared on CMI Gold & Silver.

With gold prices now over $3,000 per ounce and stock market highs returning, many folks scratch their heads and ask: why buy gold during a bull market? Most people think gold is only for when stocks tank.

Yet here we are — both gold and stocks climbing together.
This makes sense to gold investors who know what precious metals do in a solid portfolio. As markets keep rising, forward-thinking investors add gold as a buffer against the corrections that often follow long market rallies.
When the Market Booms, Gold Sparkles
At market peaks, veteran investors often feel shakiness beneath the surface. The excitement pushing stocks to record highs can mean too much risk, bloated prices, and the chance of steep drops. That’s exactly when many boost their gold holdings.
“Gold does well during times of uncertainty and when people worry about the economy and financial markets,” explains Greg McBride, chief financial analyst at a financial website, as quoted by CBS News.
This isn’t about dumping stocks but preparing for what’s coming next. Gold typically moves differently than stocks, helping smooth out your overall returns when economic conditions change.
The World Gold Council reports that central banks have been loading up on gold like never before, with countries such as China buying more for sixteen straight months through February 2025. This isn’t because they doubt today’s markets — it’s just good planning for whatever comes next.
Why Gold Keeps Its Value No Matter What Stocks Do
Gold outperformed the stock market over the past year, proving it can rise even when stocks are doing great. This challenges the old idea that gold only works during market crashes.
Several things explain why gold holds value regardless of what the stock market does:
A Hedge Against Eventual Downturns
Bull markets always end eventually. Throughout history, every long market upswing leads to corrections or bear markets. Gold gives you protection when it’s cheapest — before market sentiment changes.
According to Investopedia, gold responds to many things besides stock prices: central bank decisions, inflation fears, currency values, and world events all affect gold. These forces can lift gold prices even during strong stock markets.
Experienced investors buy umbrellas before it rains. They gradually add gold during good times, knowing that when markets get rough, gold prices surge as everyone rushes to buy.
Wealth Preservation
For investors with big market profits, moving some of their winnings into gold is just common sense. After watching their portfolio grow during bull markets, protecting those gains becomes crucial.
Gold works like “wealth insurance” for your market profits. By moving some paper gains into physical gold, you lock in wealth using something that’s kept its value through centuries of market ups and downs, currencies failing, and financial meltdowns.
This protection matters most when markets look overheated. The precious metals market offers time-tested security when other assets seem overpriced.
How Gold’s Job Changes With Market Conditions
Gold wears different hats as markets change, showing how flexible it is. During crashes, it’s your safe haven. When inflation hits, it protects your buying power. During market highs, it works as both insurance and something different from stocks.
This versatility explains why experienced investors always keep some gold, adjusting how much based on their outlook and risk comfort level. The reasons to own gold remain solid no matter what markets are doing.
While investors can buy gold through shares, ETFs, or securities, physical gold remains the most attractive option for those wanting tangible assets. Most investors choose physical gold for the security of having the actual metal rather than relying on digital or paper evidence of ownership.
We offer both bullion coins like American Gold Eagles, Krugerrands, and Canadian Maple Leafs, as well as gold bars in various sizes. Each form has different premiums and benefits, but all provide the liquidity and wealth preservation that makes gold such a valuable investment during market highs.
Final Thoughts
Gold and stocks rising together isn’t strange when you really think about it. It shows investors enjoying today’s growth while preparing for tomorrow’s changes.
As markets keep breaking records, having gold in your portfolio becomes more important, not less. It’s practical planning — markets always move in cycles, and positioning your assets to handle these changes is just good sense.
If you’re thinking about adding gold, learning the buying basics is your next move. With proper guidance, gold can protect your wealth and grow your money, regardless of today’s market headlines.
Call us today to learn more about adding precious metals to your investment portfolio, or sign up for our daily spot price emails to stay informed of market movements.
The post Why Smart Investors Buy Gold at Stock Market Peaks first appeared on CMI Gold & Silver.