
Click here to get this article in PDF
 While investors focus on gold prices, a more foundational driver of the rally is unfolding behind the scenes: gold demand is hitting multi-front records in early 2026. Most notably, inflows into exchange-traded funds (ETFs) reached all-time highs in both investment volume and total assets.
Gold ETF inflows rose across regions and strengthened during periods of volatility and uncertainty, reinforcing confidence in the metal’s outlook for the year ahead.
Record ETF Inflows Push Assets to New Highs
The World Gold Council recently released its January gold ETF flows report, and the figures reveal broad, record-setting strength across the market.
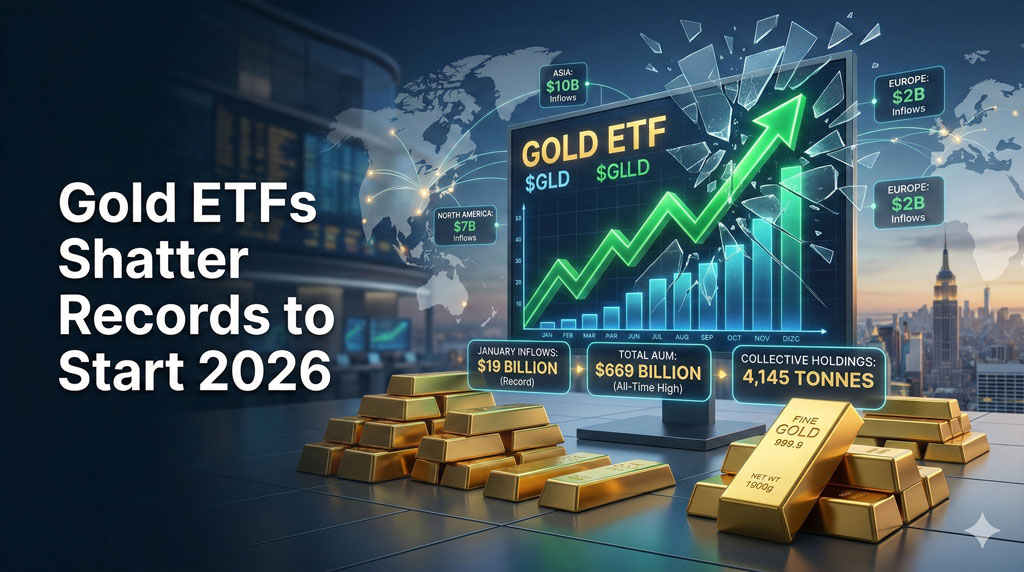
- Monthly Inflows: January recorded inflows of $19 billion, or roughly 120 tonnes, the strongest monthly intake on record.
- Assets Under Management: A sharp rise in gold prices, combined with robust demand, pushed total assets under management to a new high of $669 billion, a 20% increase month over month.
- Collective Holdings: Investor demand also lifted collective holdings by 120 tonnes to 4,145 tonnes, which is the highest amount ever.
These multiple records continue a broader trend of unprecedented gold consumption. In 2025, total gold demand broke 5,000 tonnes, the largest single-year amount in history.
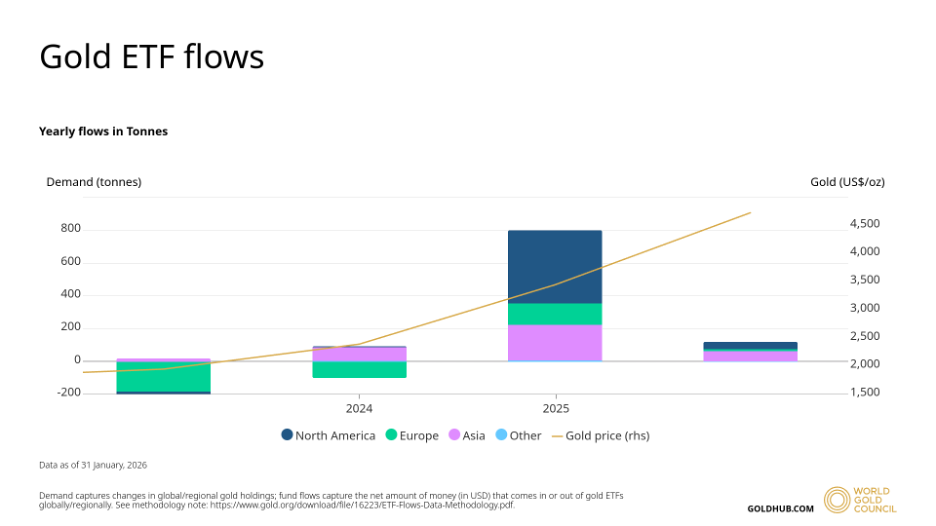
Source: WGC
Safe-Haven Demand Driven by Macro & Political Risk
WGC analysts pointed to several geopolitical, policy, and macroeconomic reasons for the steep rise in gold ETF inflows. Some of the most important early-2026 catalysts have been:
Fed Leadership Uncertainty: The Fed’s credibility crisis remains as the Trump Department of Justice investigates Fed Chair Jerome Powell, while the future of President’s nomination Kevin Warsh hangs in the balance.
Interest Rate Cuts: Following several interest rate cuts in 2025, the market anticipates the Fed continuing with its easing policy, improving the case for precious metals and other non-yielding assets.
Trade Turmoil: Trump’s tariffs remained a source of major uncertainty throughout January, and the long-awaited Supreme Court ruling on the subject did little to quell the trade upheaval.
Geopolitical Threats: Beyond trade disruption, Trump’s saber-rattling against enemies and allies alike — from Greenland to Iran — has kept markets on edge, pushing investors to safe-haven assets.
Stubborn Inflation: The inflation rate remained above target throughout January, standing at 2.4%, eroding purchasing power and reinforcing gold’s role as a store of value.
Gold ETF Inflows Flex Regional Strength
Investors across the world elevated their gold ETF investments, with all regions reporting positive inflows.
North America
Goldman Sachs’ warning about Americans showing up late to the gold rally must have been heeded, as investors in the region marked their eighth straight month of gains in January. North American investors put up $7 billion worth of investments.
Asia
Asian investors remained in the lead, recording $10 billion of inflows, accounting for more than half of total global demand. Unsurprisingly, China led the way with $6 billion of investments, making up 60% of the entire region’s stake.
Europe
Europe established January as its third consecutive month of positive demand, contributing $2 billion to gold ETFs. Notably, Europe was the only region not to experience inflows between Jan 30th and February 2nd, failing to take advantage of the dip.
Investors Bought Weakness and Hedged Risk
This record-setting surge in gold demand tells a revealing story about investor behavior when viewed alongside rapidly shifting market conditions. January was anything but stable for gold prices, which surged from roughly $4,318/oz to an interim high near $5,414/oz before tumbling more than 10% in the final days of the month as volatility intensified.
Rather than scaring off investors, the price spike and subsequent pullback triggered increased activity across both demand and trading.
Trading Volume
Trading activity exploded during the final week of the month, reaching nearly $963 billion per day and lifting the monthly average to a record $623 billion per day — about 72% above 2025 averages. Exchange trading volumes surged as volatility intensified, highlighting increased hedging and tactical positioning.
Demand
Demand strengthened even as prices reached record highs. Over-the-counter (OTC) activity rose to roughly $280 billion per day in January, reflecting increased physical market trading. At the same time, derivatives trading climbed to about $320 billion daily, up 73% since last month, as investors hedged and repositioned amid heightened volatility. Global gold ETF trading also surged, rising sharply as month-end volatility drove increased positioning and risk-management activity.
Powered by WPeMatico