
Click here to get this article in PDF
Gold’s pullback below $5,000 may look dramatic, but the bigger story isn’t short-term price action. The rapidly shifting macroeconomic and geopolitical landscape suggests the foundational drivers behind the precious metals rally are actually stronger.
In this week’s The Gold Spot, Scottsdale Bullion & Coin’s Precious Metals Advisor Joe Elkjer and Precious Metals Advisor Todd Graf discuss gold’s decline and what it means for future prices, how the Iran war impacts the federal deficit, and why the petrodollar is back in the economic spotlight.
Gold Under $5,000/oz: Downturn or Correction?
The precious metals market has fallen quiet compared to its roaring growth in the early innings of 2026. Within January alone, gold prices skyrocketed from $4,318.11/oz to over $5,600/oz. Since charting this all-time high, prices have settled below $5,000/oz. This stark turnaround has some people wondering if gold is entering a downturn or correction.
Although gold has declined by around 18% since its January peak, the metal is still up by nearly 10% year to date. Zooming out a little further, gold prices climbed from $2,624.50/oz to over $5,600/oz from January 2025 to January 2026, representing a doubling in prices within about a year.
At the moment, this dip below $5,000/oz may seem dramatic, but it’s a healthy correction following a stellar rally. The 2026 gold price predictions from some of the leading financial institutions remain bullish, too. J.P. Morgan and Wells Fargo predict gold prices will reach $6,300 an ounce by year’s end, with many other financial institutions expecting gold to exceed $6,000 an ounce.
“Gold ran from $2,600 to $5,000 in 12 months. So a pullback is expected. It’s healthy and an opportunity for buyers. The fundamentals haven’t changed.”
Todd Graf
Precious Metals Advisor

Federal Deficit Forecasted to Hit $2 Trillion
A few weeks ago, the Congressional Budget Office (CBO) — a nonpartisan financial watchdog — released its annual report: The Budget and Economic Outlook: 2026 to 2036. Alarmingly, the report suggested the federal deficit could hit $1.9 trillion in fiscal year 2026, which lasts from July 1, 2025, to June 30, 2026. The federal government raced to spend the first trillion within just five months, per the CBO.
This grim prediction would put the federal deficit at 5.8% of gross domestic product (GDP), but that figure is expected to rise to 6.7% by 2036, indicating that debt is rising faster than economic growth. The federal deficit hit $1.8 trillion in FY 2025.
 SUGGESTED READING
The Gold Spot Exclusive: America’s Fiscal Reckoning? Congressman David Schweikert Weighs In
READ NOW
Iran War Threatens to Explode Deficit
It’s crucial to note that these abysmal numbers were calculated prior to Trump’s war with Iran. The Center for Strategic and International Studies reports that the military action in Iran has cost the American people $11.3 billion in the first six days and $16.5 billion by the middle of the second week.
Put another way, the government is spending about $1 billion each day, primarily on precision munitions. Due to the campaign’s rapid development, virtually none of these extreme costs have been budgeted, further ballooning the federal deficit.
Interest Rates & Inflation Weigh on Debt Payments
Various knock-on effects of this war further complicate federal spending and national debt. The economic impact of this conflict, especially following a tepid 0.7% GDP — according to the Bureau of Economic Analysis — in the last quarter of 2025, is likely to keep interest rates steady. This makes interest payments more expensive.
That’s to say nothing of the inflationary impact of higher oil prices, which suffered from their highest surge since the 1970s. Recently, gas prices leapt by 30%, per the Financial Times. The midterm shakeup coming in November is unlikely to change anything, with fresh faces in Congress most likely focused on telling voters what they want to hear rather than the harsh truth.
U.S. Debt Exceeds $39 Trillion
The U.S. national debt reached another bleak milestone this week, hitting $39 trillion. This towering figure is nearly double what it was at the beginning of Trump’s first term. In 2017, experts were already ringing the alarm bells about U.S. debt, which was over $17 trillion. At its current pace, the debt bubble could expand to $50 trillion by 2030, according to Forbes.
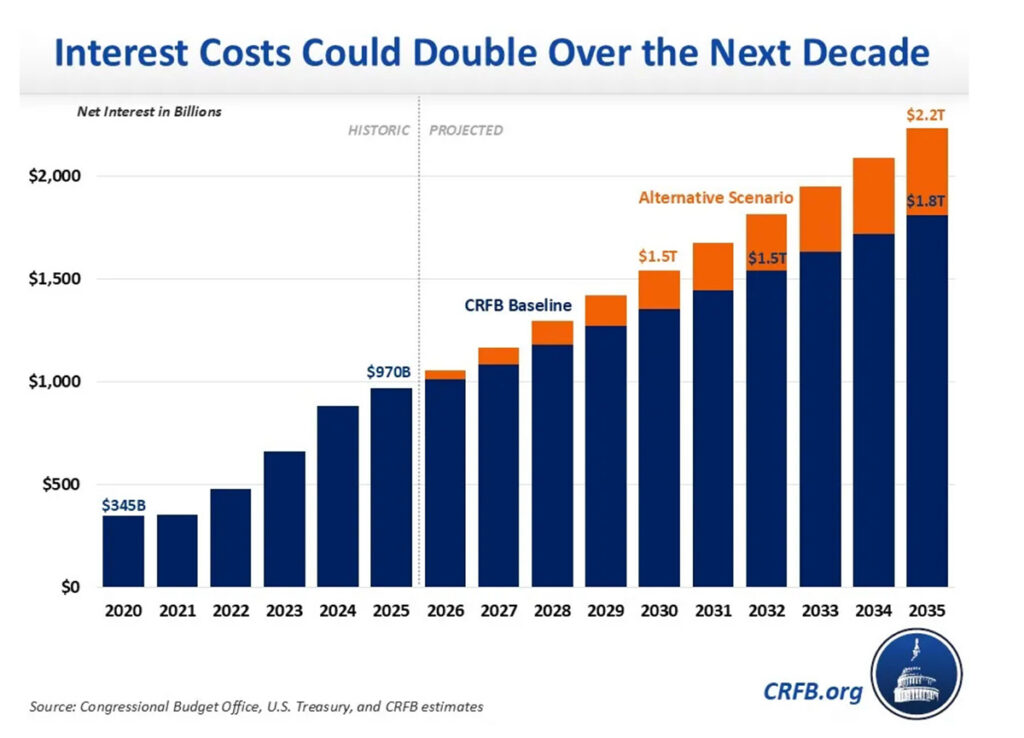
Simultaneously, the cost of servicing the ever-growing debt is surging. Currently, interest costs $1 trillion annually, though the CBO projects this figure could double by 2035. Effectively, the federal government is borrowing to cover the exorbitant interest costs, creating a self-reinforcing debt spiral.
Repricing Gold in a Debt-Driven World
The U.S. may have abandoned the official gold standard, but the Federal Reserve is still home to the world’s single largest gold reserve. Currently, the U.S. owns about 8,133 metric tons of gold. As the national debt rises and the ripple effects extend throughout the economy, gold’s stabilizing effects are coming back into sharp focus. Even with the largest gold holdings, America’s reserves still represent only about 3% of its debt. In other words, the economy has only about $0.03 for every $1 owed.
The gold-to-debt levels are at historic lows, which leaves plenty of running room for the yellow metal to rebalance at prior ratios. For instance, gold represented about 18% of the national debt in 1980. If gold were to reach this percentage at current debt levels, gold prices would hit $26,000/oz. A return to historic highs, when gold represented 50% of debt in the 1940s, gold prices would sit at $75,000/oz.

Chart image source: Tavi Costa
“It’s not predictions or speculation; it’s simple math. With every unbudgeted expenditure, every interest payment rolled into principal.”
Todd Graf
Precious Metals Advisor
The Petrodollar Comes Back Into Focus

With the Iran war raging far past the initial deadlines set by the Trump administration, energy prices skyrocketing at paces not seen in decades, and the dollar experiencing uneasy volatility, a crucial yet often overlooked cornerstone of the global financial system is back in the spotlight: the petrodollar.
“The fundamental case for gold got stronger this month, not weaker, and the forces that drive gold are increasing daily.”
Todd Graf
Precious Metals Advisor
By tying the dollar to the daily energy trade, the U.S. was able to position the dollar at the center of the global economy. However, a combination of dollar weaponization and domestic fiscal fecklessness has driven countries away from USD dependence (de-dollarization), and the recent action in Iran is likely to only speed up this process.
In our Petrodollar Report, we break down how this system works, why it matters in today’s environment, and what it could mean for gold moving forward. Request your FREE COPY today!

The Petrodollar: A Retrospective – How To Prepare For The Impending Dollar Failure
Get Report – It’s Free!
Question or Comments?
If you have any questions about today’s topics or want to see us discuss something specific in a future The Gold Spot episode, please add them here.
CommentPowered by WPeMatico
Questions or Comments?
“*” indicates required fields