Click here to get this article in PDF
For the first time in more than six years, gold broke through a key level. Gold surged on Friday due to the geopolitical tensions stemming from the Middle East after the U.S. took out Iran’s top military leader.
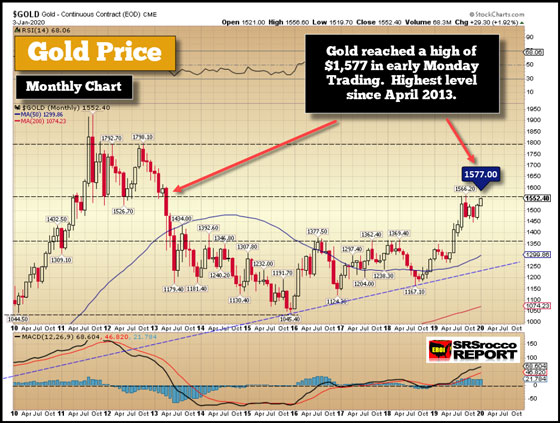
During early trading in the early Asian markets, the gold price continued even higher, reaching $1,579.
This morning, gold is trading at the $1,575 level. It will be interesting to see if gold closes at the end of the day near its high or a low. The key resistance level is $1,550, which gold surpassed by $25.
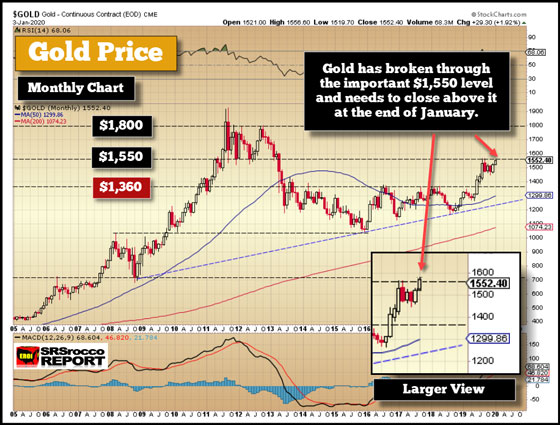
Here is gold’s monthly chart below (each candlestick represents one month of trading).

If you look at the “Larger View” insert, I have superimposed the candlestick breaking through the Key level.
The Gold price finally broke through this level, and for it to remain in a bullish trend in the monthly chart below, it will have to close above the $1,550 (actually $1,560) level by the end of January. If we look at the next chart, the gold price surpassed the high of $1,566 in September:

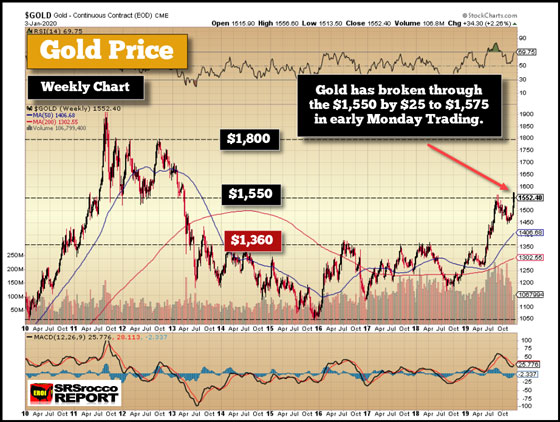
Gold is currently trading at $1,574. And, if we look at the weekly gold chart, we can clearly see gold breaking through the $1,550 level:

Here we can see the three Key Levels for gold. After the big run-up in the summer, I thought gold would retest its breakout level of $1,360 before moving higher. While it’s not a guarantee that gold would retest this $1,360 level before moving higher, traders typically expect it to happen.
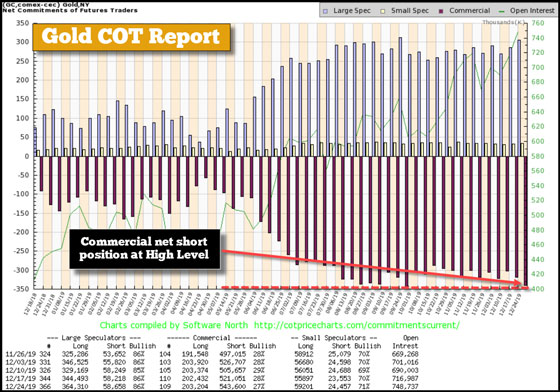
Furthermore, the latest Gold COT Report shows the Commercial Net Short position at the highs from last summer:

This is a very strange situation for gold. Due to the Fed continued Repo Market intervention and the $60 billion a month in U.S. Treasury purchases, it seems that gold just won’t selloff or correct down to that $1,360 breakout level.
However, with the Commercial net short position at a high, logic suggests that gold will likely correct lower before resuming its trend higher in 2020.
Moreover, at some point, the bloated U.S. stock market will need to experience a correction lower, even if it continues higher due to the massive Fed and Central Bank liquidity. Thus, the gold and silver price may correct lower with the broader markets once a correction takes place.
But, again… this is only short-term trading possibilities. The situation for the U.S. Financial and economic system is heading for a BRICK WALL. Only 1% or less of investors have diversified some of their assets into gold (and silver).
